Considering Biases at the Data Cleaning Stage
Chris’s work on hierarchical clustering made it clear that the families in our data are dynamic. They often change across enrollments, growing as children are born and family members reconnect, shrinking as members break away and occasionally reappear in enrollments with other families. The data reflects the complex and mutable relationships that comprise families – which makes perfect sense, since no family is truly static. This raises questions about how to best track a family and its characteristics, and how our methods will ultimately affect the results of our statistical analysis.
This issue alludes to the broader challenges of data bias, which are introduced to the data by the decisions we make about which variables to track and which variables to ignore. A common theme that has emerged from the data science workshops we’ve attended is that collecting and cleaning data is an inherently subjective process. Many data sets are collected by a particular entity to answer specific types of questions to accomplish a particular goal. The quality of survey data often hinges on the wording of the survey questions, which can be influenced by the researcher’s own biases. A confusing or misleading question can lead to a misleading variable. Therefore, to an extent, data reflects the researcher’s values and belief systems, and does not necessarily quantify objective truth.
Similarly, the way we track families may be informed by our own ideas of what it means when families change, and what variables best characterize these families. Therefore, it is important for us to keep in mind that the final “clean” dataset that we ultimately use for statistical analysis contains various derived variables that reflect the way we think families behave. Thinking about biases inherent to the data-cleaning stage - well before we even begin any statistical analysis - is an important and often overlooked issue in my field.
Fields like economics place much of the scrutiny on p-values, which are used to judge the effects of regressors on a dependent variable in a statistical model. However, a p value is simply the probability of getting the same results (or more extreme results), given that the null hypothesis (that your regressor has no effect) is true. A small p-value does not necessarily mean that you have proved causality or even correlation, especially because arbitrary levels of statistical significance can be achieved by changing the ways in which data is cleaned and summarized
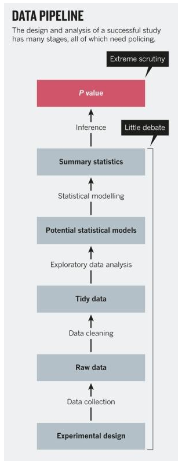
Weeks of data cleaning have taught me that the same amount of scrutiny that is placed on p-values should also be placed on the steps that come before statistical analysis, when we are constructing our derived variables and making decisions about how to understand changing families. To minimize bias at the data cleaning stage, we have been getting as much context on the data as we can from the county data leads, who have more intimate knowledge about how the raw data was collected and how certain variables should be interpreted. We also aim to supplement our measures of statistical significance by adding a machine learning component to our analysis through, among other methods, regularized regression, which will prevent over-fitting and make the model generalizable to new data.