CrowdCensus Team's Data Exploration
The goal of the CrowdSensing Census project in DSSG 2016 is to develop a reliable and general model that can predict socio-economic levels of a city by making use of other real-time data such as OpenStreetMap data or Cellphone Detail Records (CDR) data. This work is meaningful because it improves data freshness and cost efficiency compared to census data: government-initiated socio-economic statistics are expensive and often outdated (10-year term).
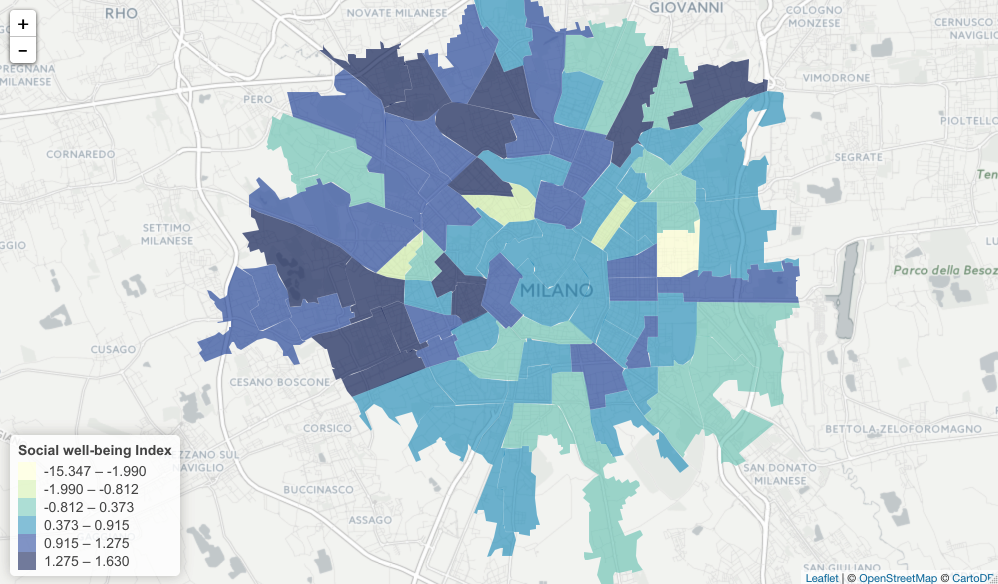
Specifically, we are developing a prediction model from available datasets targeting the city of Milano and the province of Trento, Italy. We target these cities as the Big Data Challenge initiative made it possible to open Telecom Italia data (CDR) to the public (Barlacchi, et al., 2015). As ground truth estimates of census-level variables, we are trying to make use of the census data that include, but are not limited to, the statistics about illiteracy, school degree, proportion of foreigners in a census tract, rented dwelling, unemployment and work force participation. We first conducted Principle Component Analysis (PCA) for the non-monetary variables about citizen well-being. The PCA was used to see whether the variables represent a single dimension of socio-economic status. This is the social well-being index (tentative) used in the image presented below.

Currently, the first component of the PCA result accounts for only about 40% of the variance in these variables, so it may not be a strong indicator of a single measure for the socio-economic level. Despite this weakness, we tried to use the measure to see the relationship with the CDR data (i.e., aggregated call-in, call-out, sms-in, sms-out, and internet usage) as an exploratory data analysis. The regressions showed that there were no significant relationships between cellphone activities and quasi (?) socio-economic levels. This was an expected result, because cellphone activities vary a lot depending on time and day. To further the analyses, we have extracted time- and day-specific cellphone activity values and will conduct more granular analyses this week.
The biggest challenge that we face now is data availability. The available census data are not enough to determine the level of poverty because it lacks the most important variable – the income data. Official socio-economic measures/constructs include the United Nations (UN)’s Multidimensional Poverty Index (MPI) that consists of ten variables such as education, health and living standard and the World Bank’s income data and consumption expenditure. Since both the income and several health/living standard variables are not available from the open government websites, we are actively working on finding data sources that can be used for the ground truth of the study.
Even though we are struggling with data availability, we have learned many useful techniques and tools for the last two weeks as we are exploring the data. Due to the large size of the datasets, we first learned how to increase computation efficiency for analyzing the data. For example, using the Pandas library in Python was very effective in conducting matrix-based calculations. In a similar way, R provides the dplyr package for dealing with a large file. In the last few days of work last week, we found that some CDR datasets were too big to fit into local machine storage. This led us to explore Spark running on AWS instances, which allows us to use the MapReduce framework, a cloud-based parallel computing framework for big data, using Python interfaces. As our data-management skills improve with various tools, we hope to provide meaningful insights/results in the near future.