ORCA: Transactions data and bias estimates
Following two weeks of intense tutorials on various data science tools, the ORCA team is very excited to finally enter the substantive portion of our project this summer! The four fellows - Carolina, Victoria, Alicia, and Sean - have been busy exploring the datasets in Week 3, along with our project leads and data scientists. One of the most intriguing aspects of our project is the data we are working with. We begin with two datasets, each containing nine weeks’ worth of ORCA farecard transactions. These are large and noisy data; there are endless possibilities for analyses, but a significant amount of data cleaning will be necessary. In addition to the raw transactions data, we inherited datasets containing trips and transfers (with estimated origins and destinations) information that are generated from transactions data. These three datasets, in conjunction with Automatic Vehicle Location (AVL) and Automatic Passenger Count (APC) data provided by various transit agencies in the Puget Sound region, gave us a solid foundation going forward.
We accomplished two objectives during Week 3. First, as of June 30, we finally have a secure server set up on AWS for us to work in! Given the private and sensitive nature of the data we are working with, security is of utmost concern, and our data scientists worked diligently to set up our access to ensure data privacy. Along with AWS set-up, we learned how to maintain security while working with AWS server in various applications like R and qGIS.
After much deliberation, we also agreed on a project charter and a timeline for the rest of the summer. We found this process generative, as our discussions around project ethics, goals, and deliverables directly informed the technical details and workflow we ended up with. In particular, our vision of transit equity and social good led us to the major collaborative component of our project this summer, where we will develop different bias estimates for ORCA datasets. Bias estimates are important for both ethical and technical reasons. A data-informed transit planning relies on data very much like the ORCA datasets we are working with, but these data are very much imperfect, so a thorough understanding of the biases implicit in these datasets is crucial before any analyses. In terms of ethics, if transit planning decisions are made based on these analyses, then we want to ensure that we do not underrepresent particular populations or areas. Said more simply, if we do not develop a good bias estimate, then our analyses risk amplifying existing inequities in our public transit system.
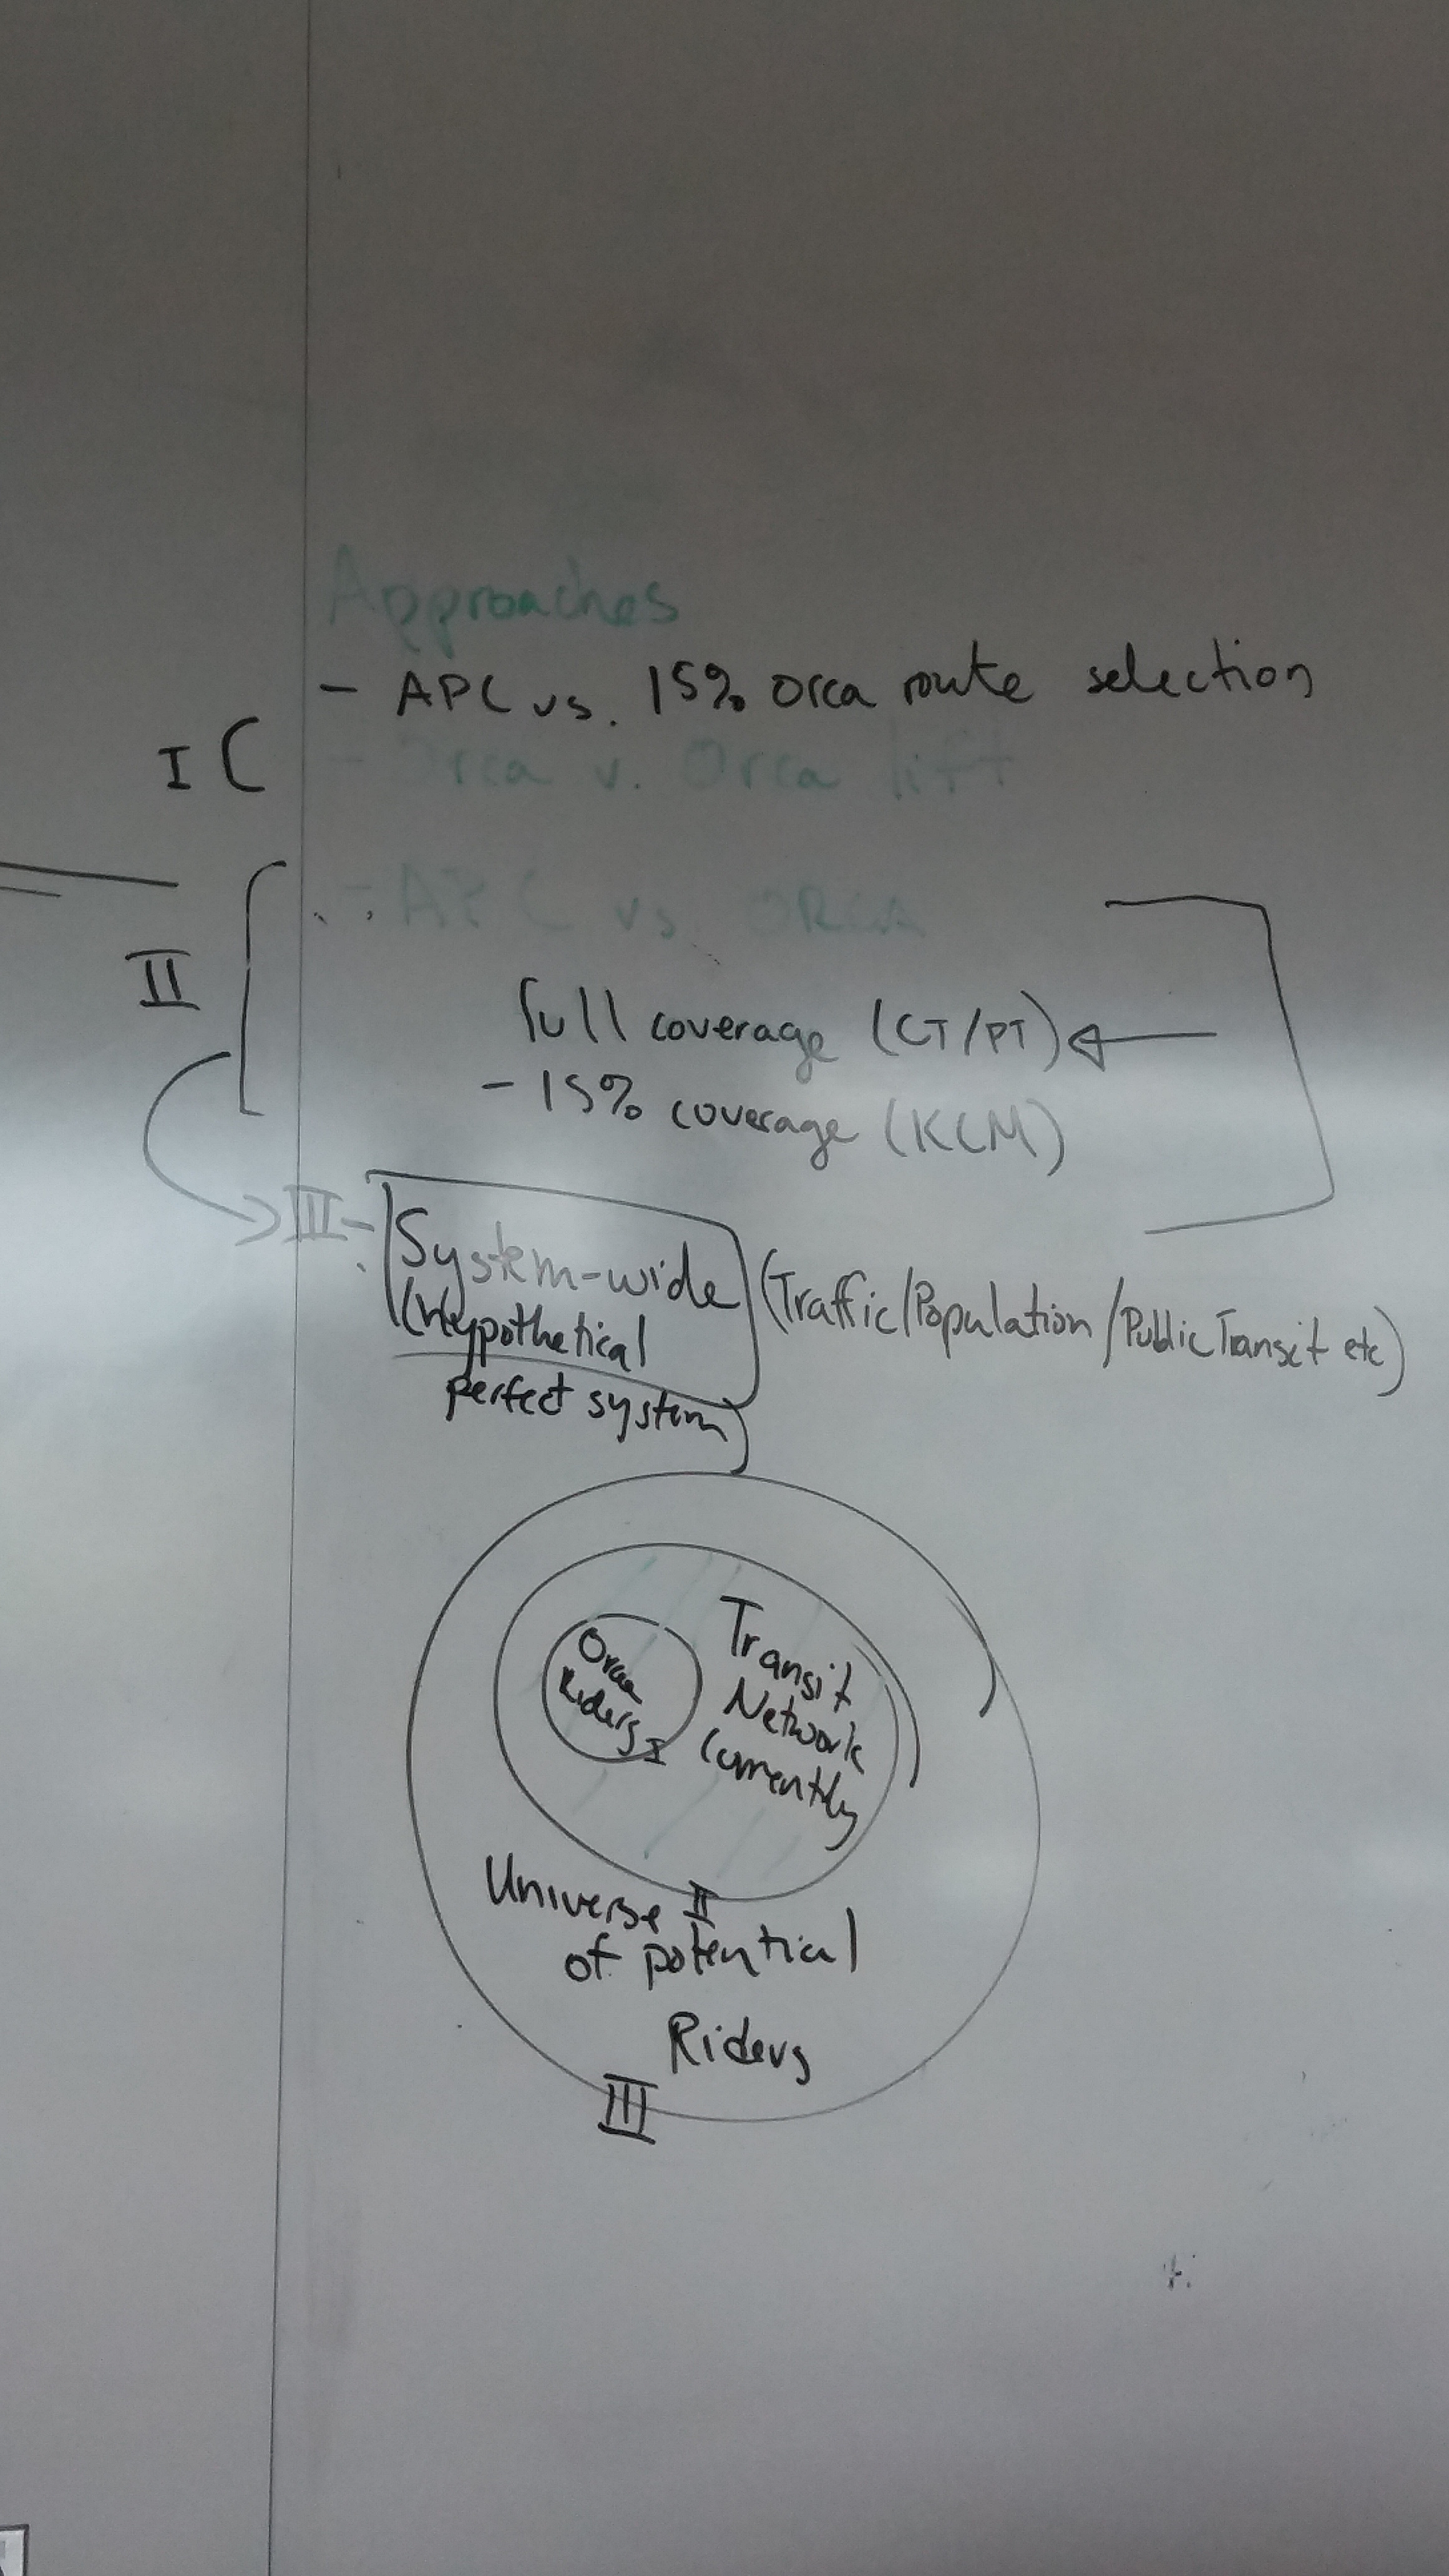 To get at these biases, we have to visualize ORCA transactions data in a nested relationship: our ORCA transactions data only captured ORCA farecard users, which is a subset of the entire ridership. The entire ridership itself is also a subset of the entire population of the Puget Sound region. (Within the ORCA data, we can further divide based on pass types like subsidized senior or low-income cards.) Census data gives us the entire population in the region, while APC data gives us the “true” number of passengers. Unfortunately, while APC gauges are universally available for Community Transit and Pierce Transit, they are only deployed on 15% of King County Metro’s (KCM) vehicles (and their deployment is only representative of the entire network during weekdays). Thus, we are interested in developing bias estimates for at least three types of biases: (1) whether KCM’s 15% APC deployment gives us random distribution along its routes; (2) what are the differences between ORCA data and the entire ridership (100% APC or 15% APC for KCM only); and (3) what are the differences between the ridership and the entire Puget Sound population.
At the moment, we are doing a thorough literature review to figure out how past transport geography studies have joined boardings-only data (like our ORCA dataset) with additional data sources like AVL and APC, and whether they developed a way to measure bias. We are also interested in studies that only had a sample for its “true” population (like our KCM 15% APC data), and so far it’s been physical geography (e.g., climatology and hydrology) that provided the most promising leads. We hope to develop a set of statistical methods to get at these biases by the mid-point presentation in Week 6, so check back then for an update!