Data Walk: Construction
Our Story
 Data walking is the process of wandering around and reflecting on the data that you encounter. The idea is to learn to look for data in everyday objects and in your surroundings. As you wander, you should discuss what data means to you, how you know when data is present, how data can be different for different people, and how transmission of data affects real life. You should also interview some people that you meet to understand different perspectives. Reflecting as you walk, your mission and themes of interest can evolve over time.
When the ethnographers at the eScience Institute were explaining all this, our collective reaction was a healthy amount of skepticism. As it was a totally new concept, we were not entirely sure how beneficial wandering the streets of Seattle would be. However, when we grouped up, the confidence level rose. Each of the groups was tasked with focusing on a different theme. Our group was assigned to think about community and stakeholder engagement in the realms of data science. One of the team members immediately suggested that we investigate the construction on campus and everyone readily agreed. We were all pretty excited that we had assigned some focus to this rather ambiguous task. While we did not have total understanding of how the data walk would work, we all were fairly trusting in the process. After quick assignment of roles (Navigator, Photographer, Map-Maker, Note-Taker, Interviewer, and Collector), we were on our way!
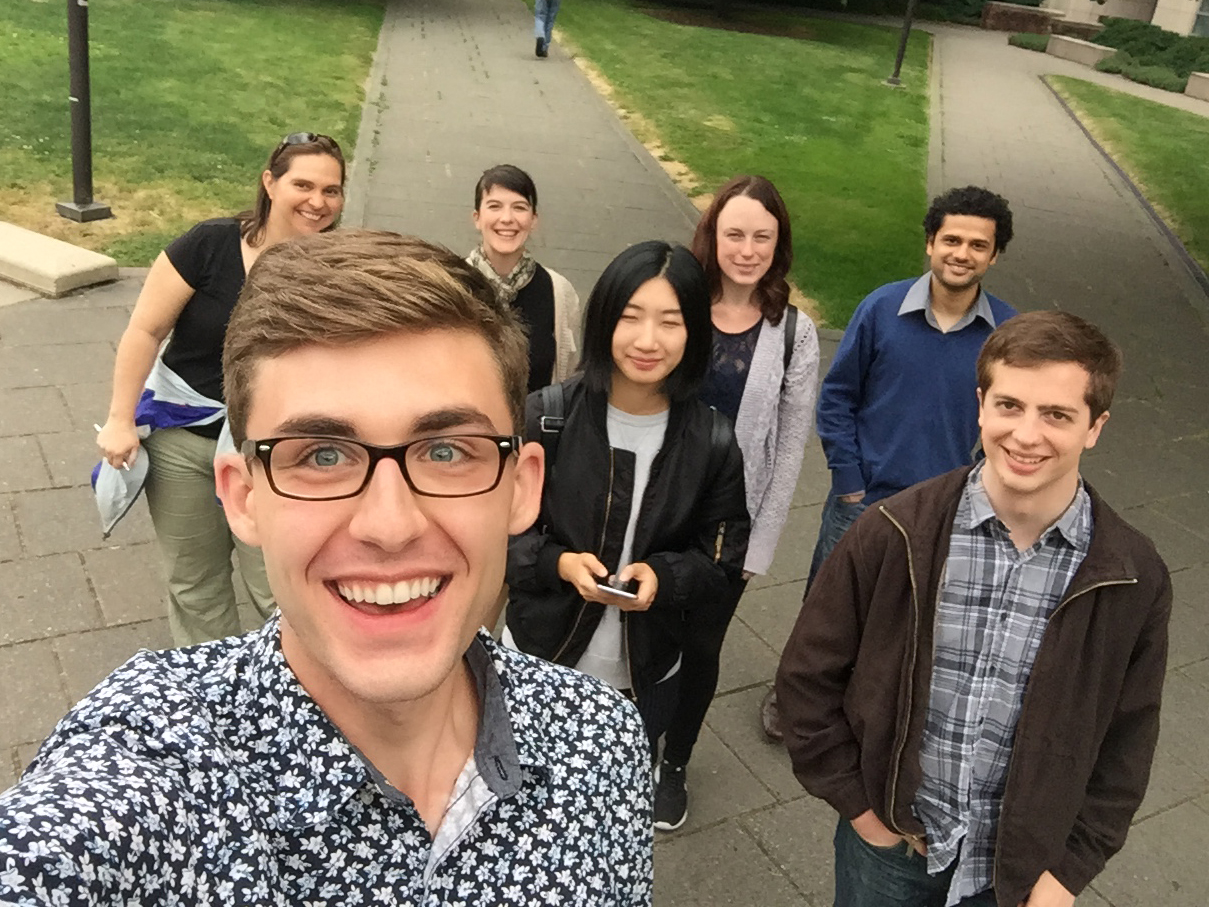
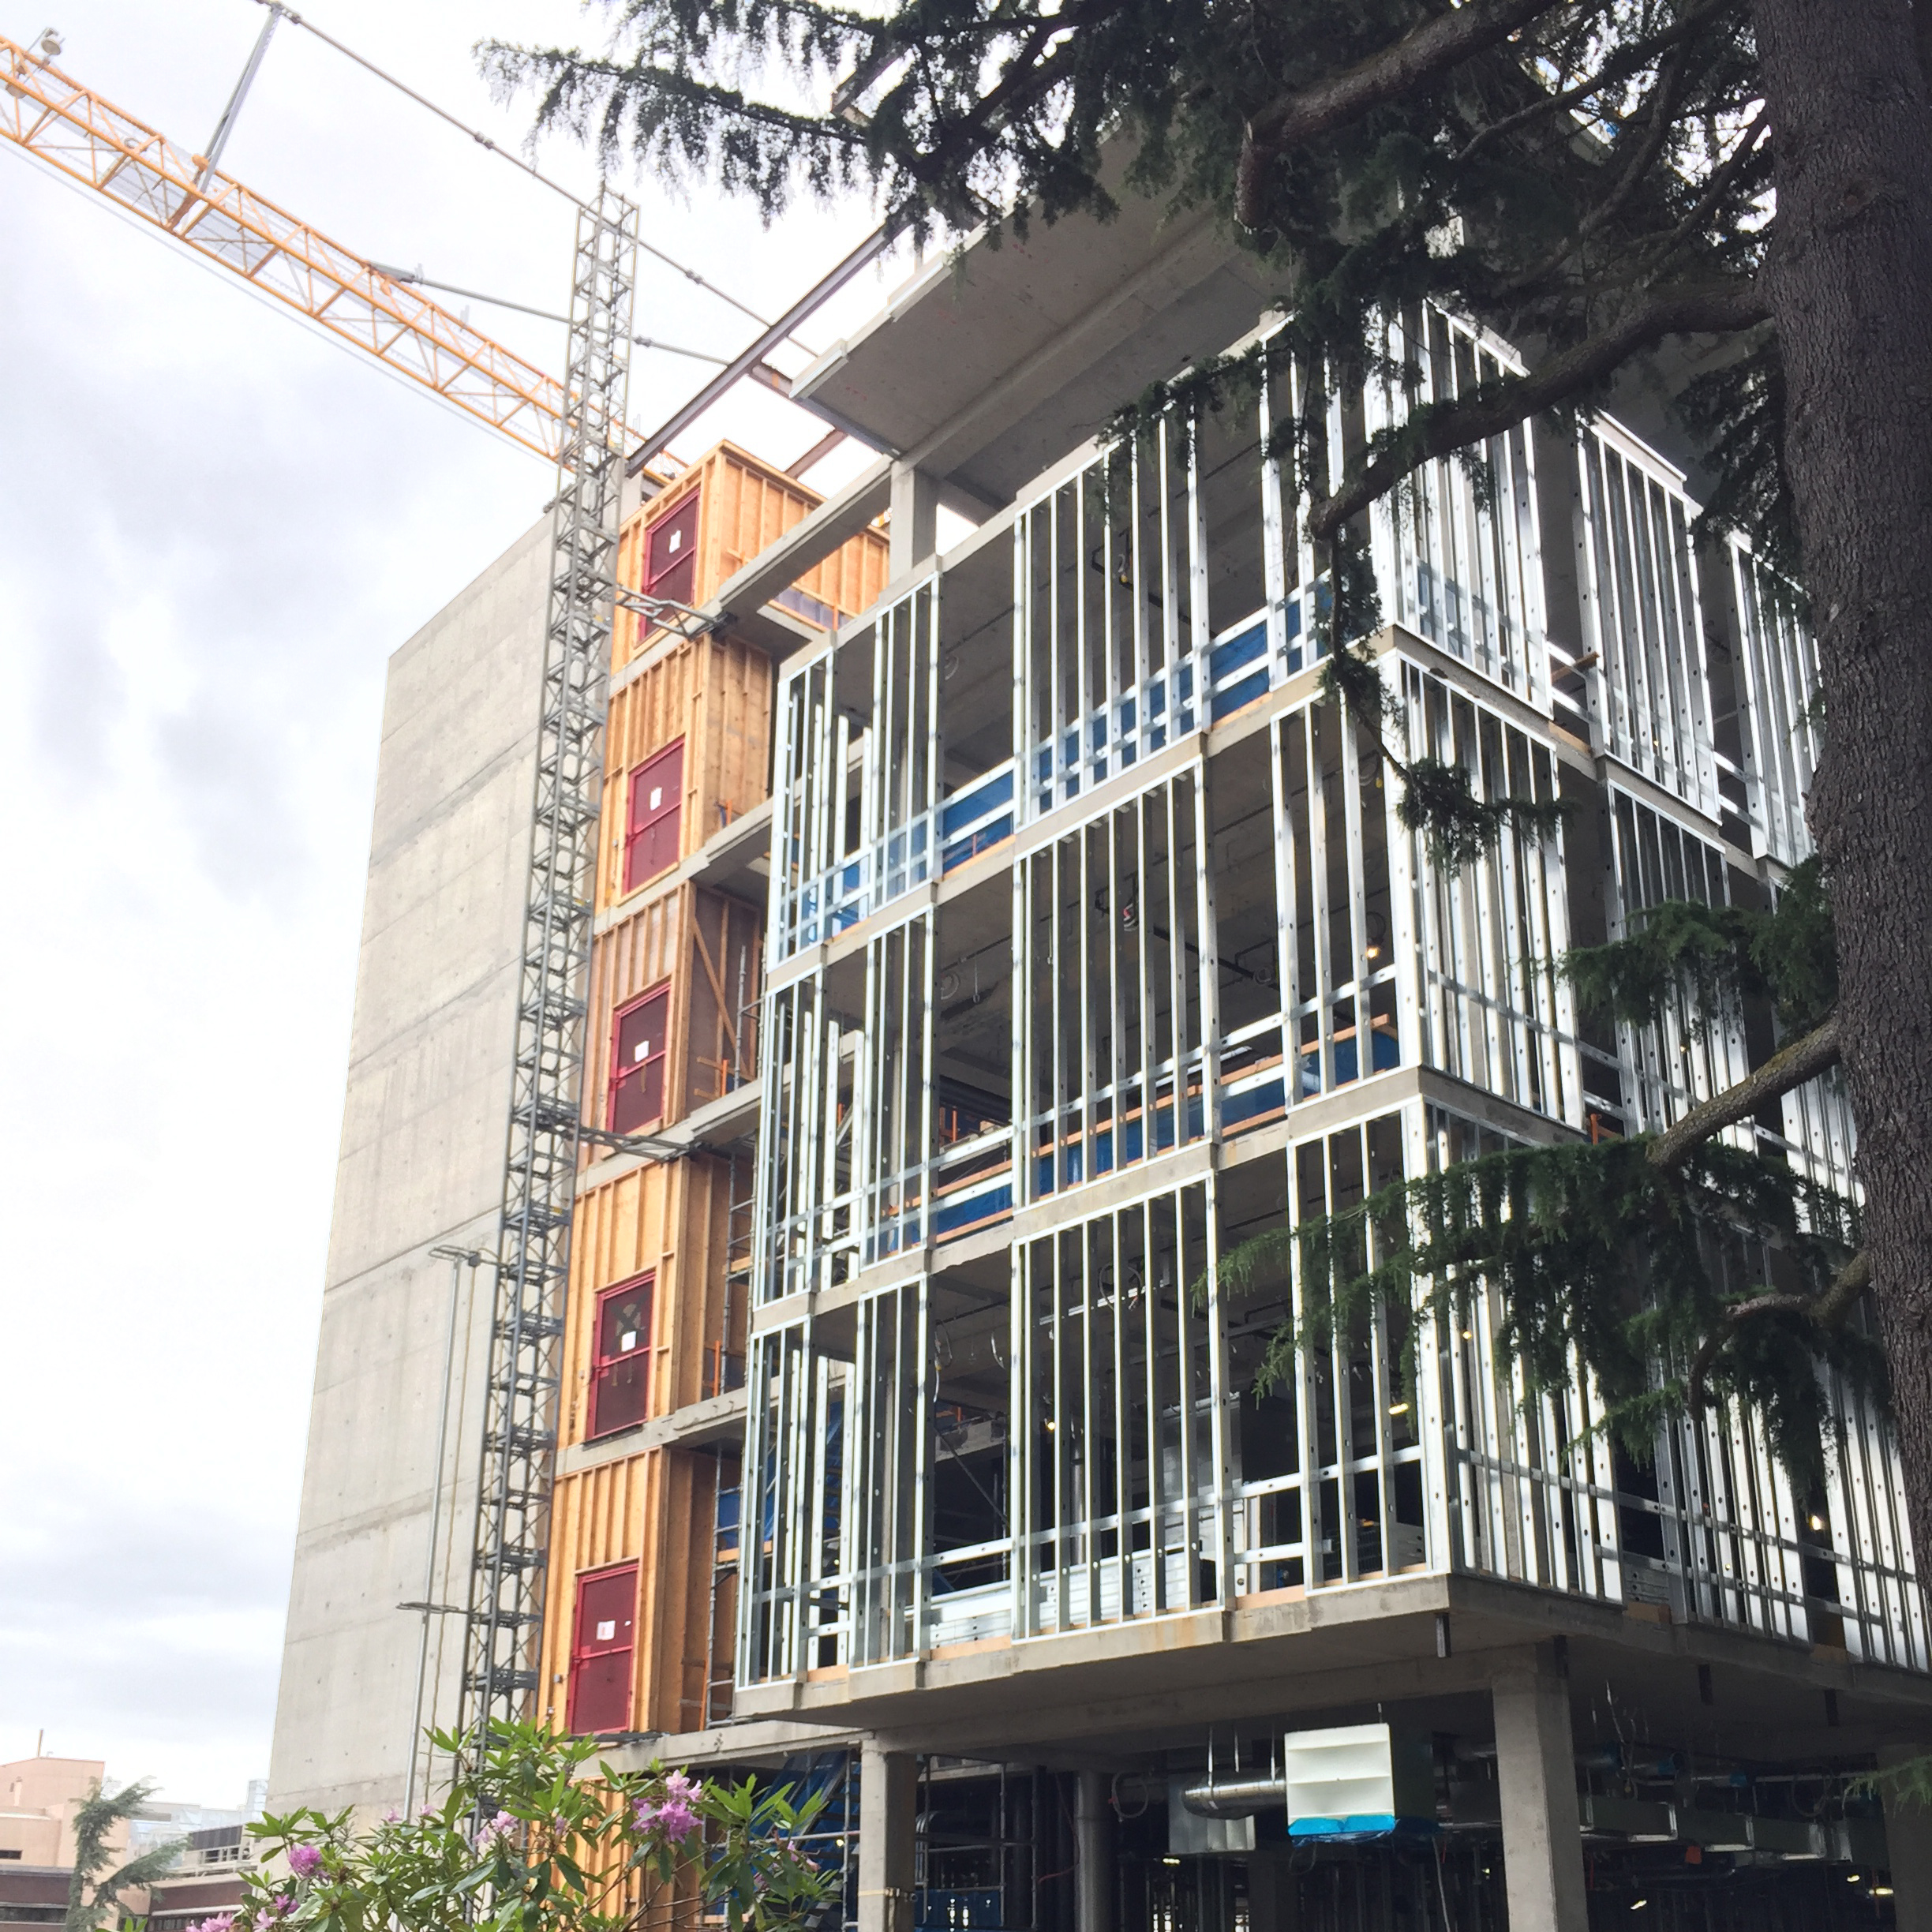
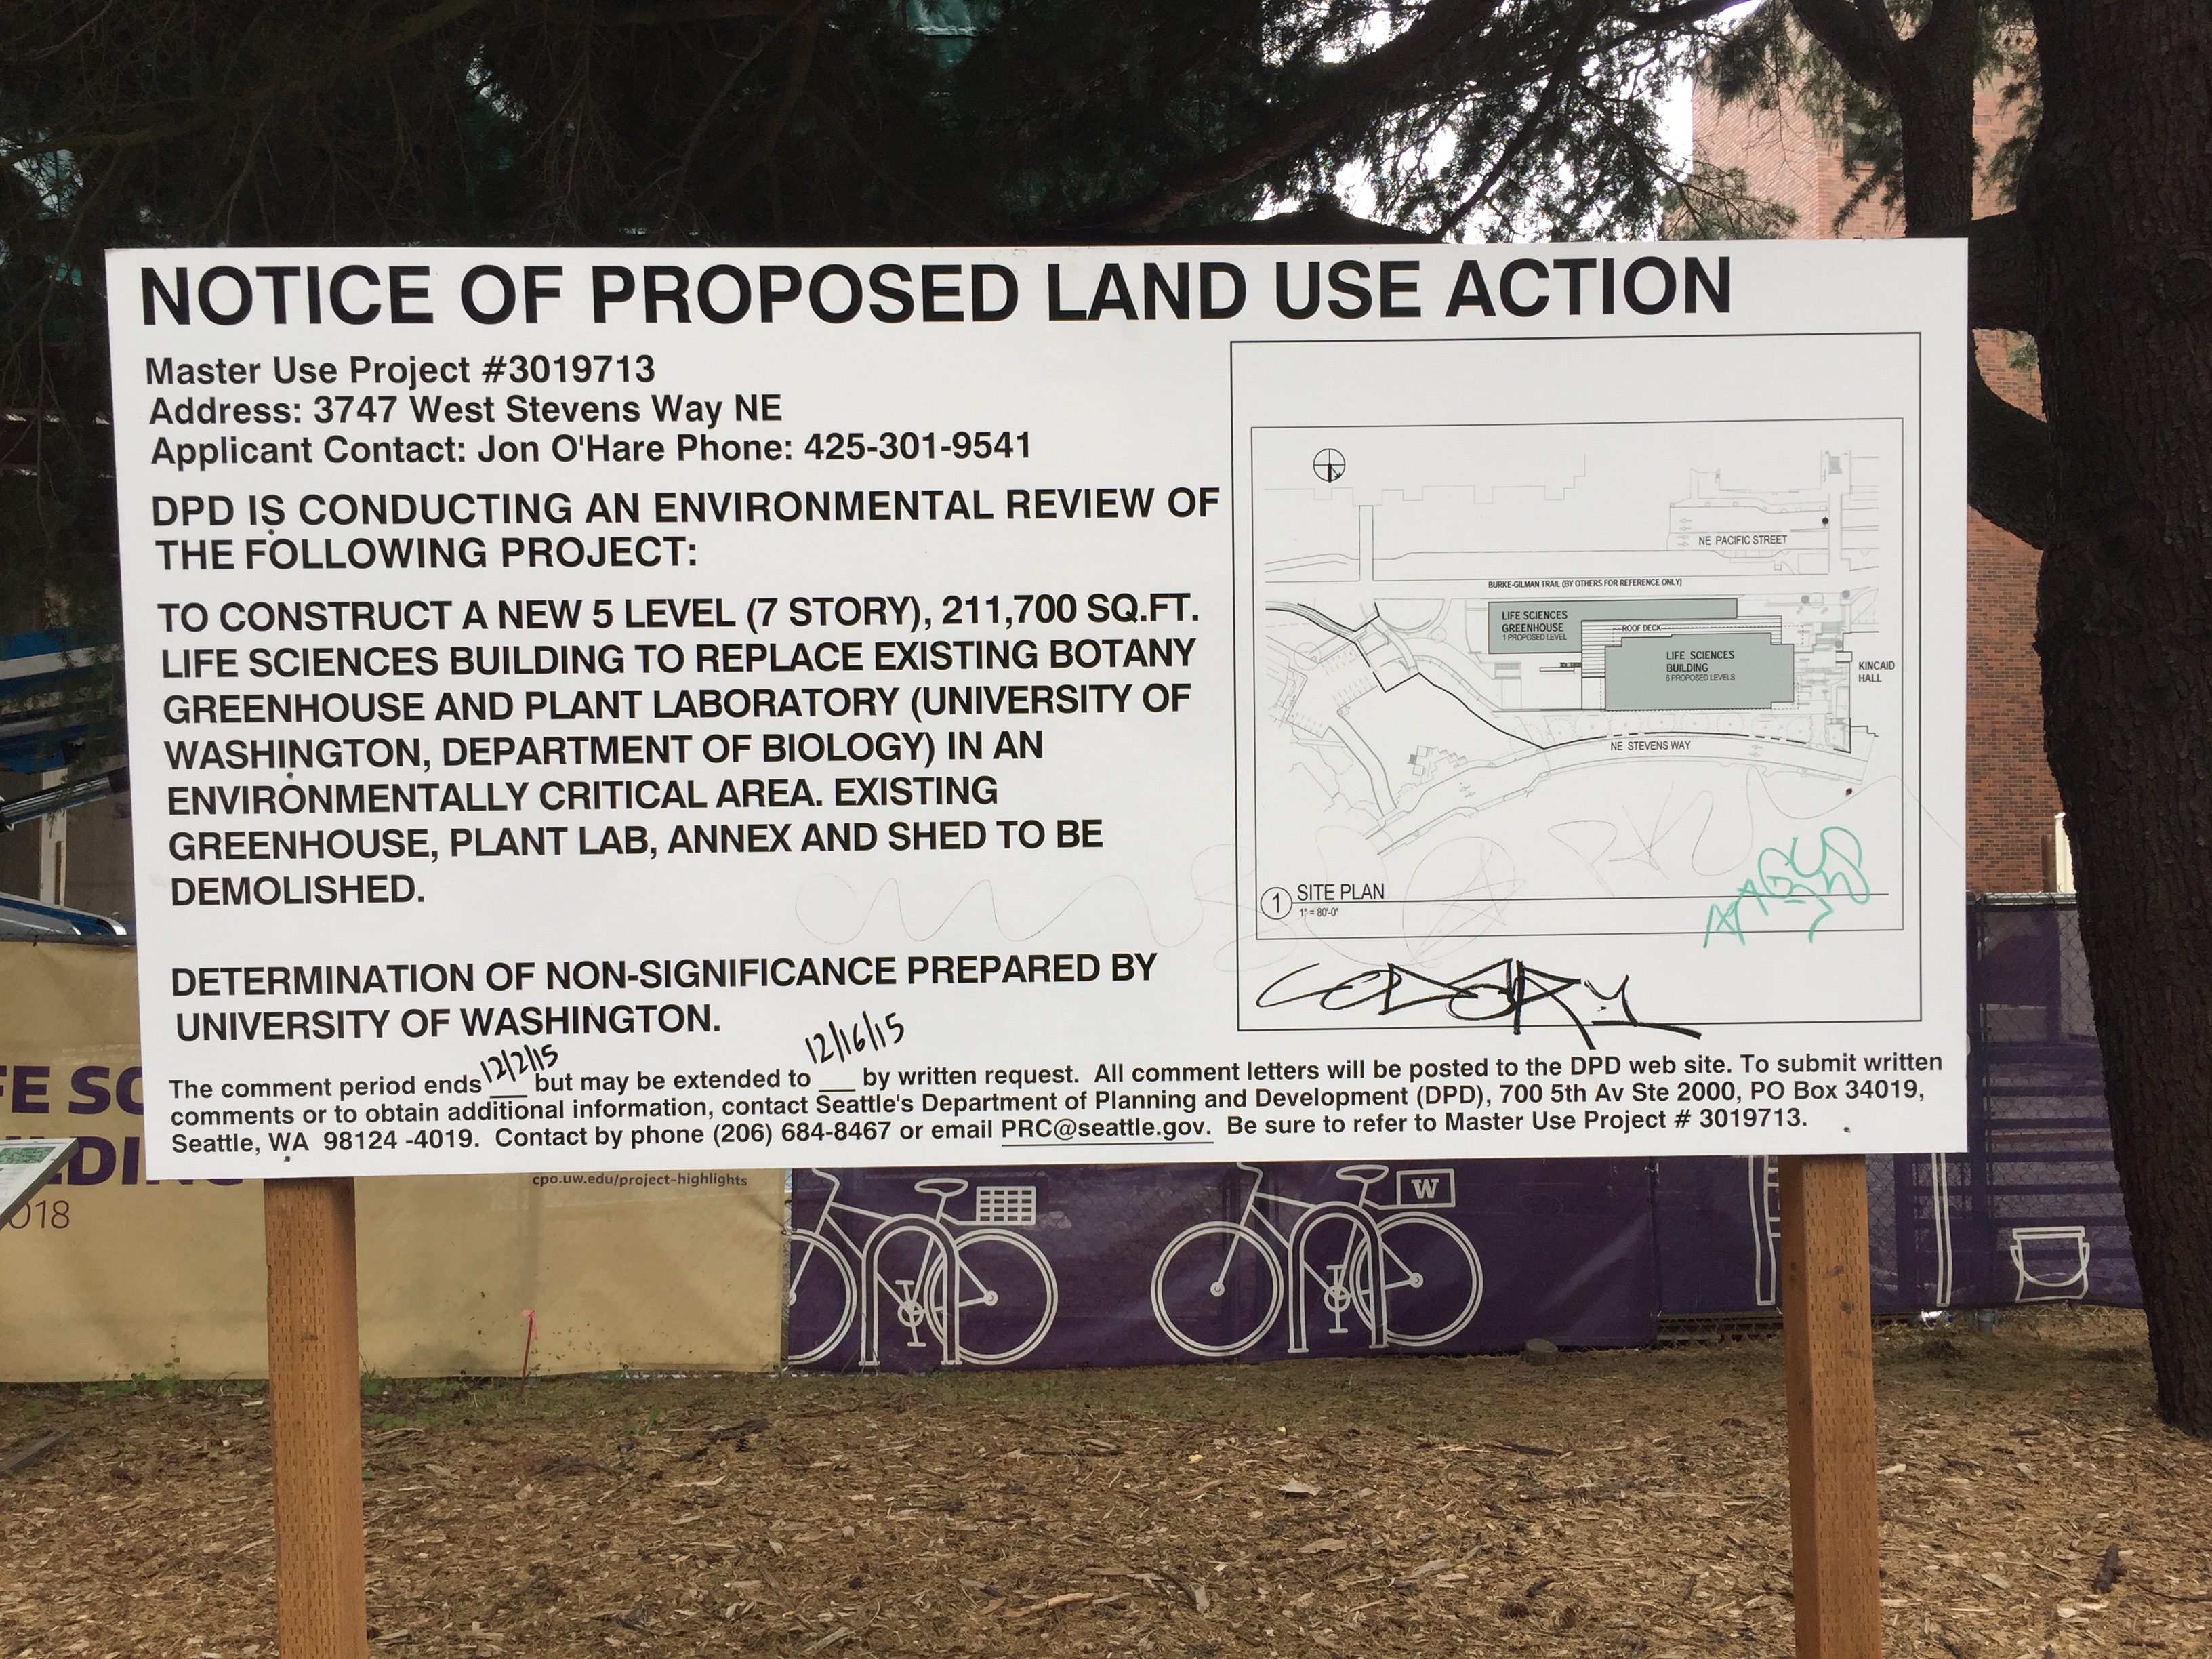
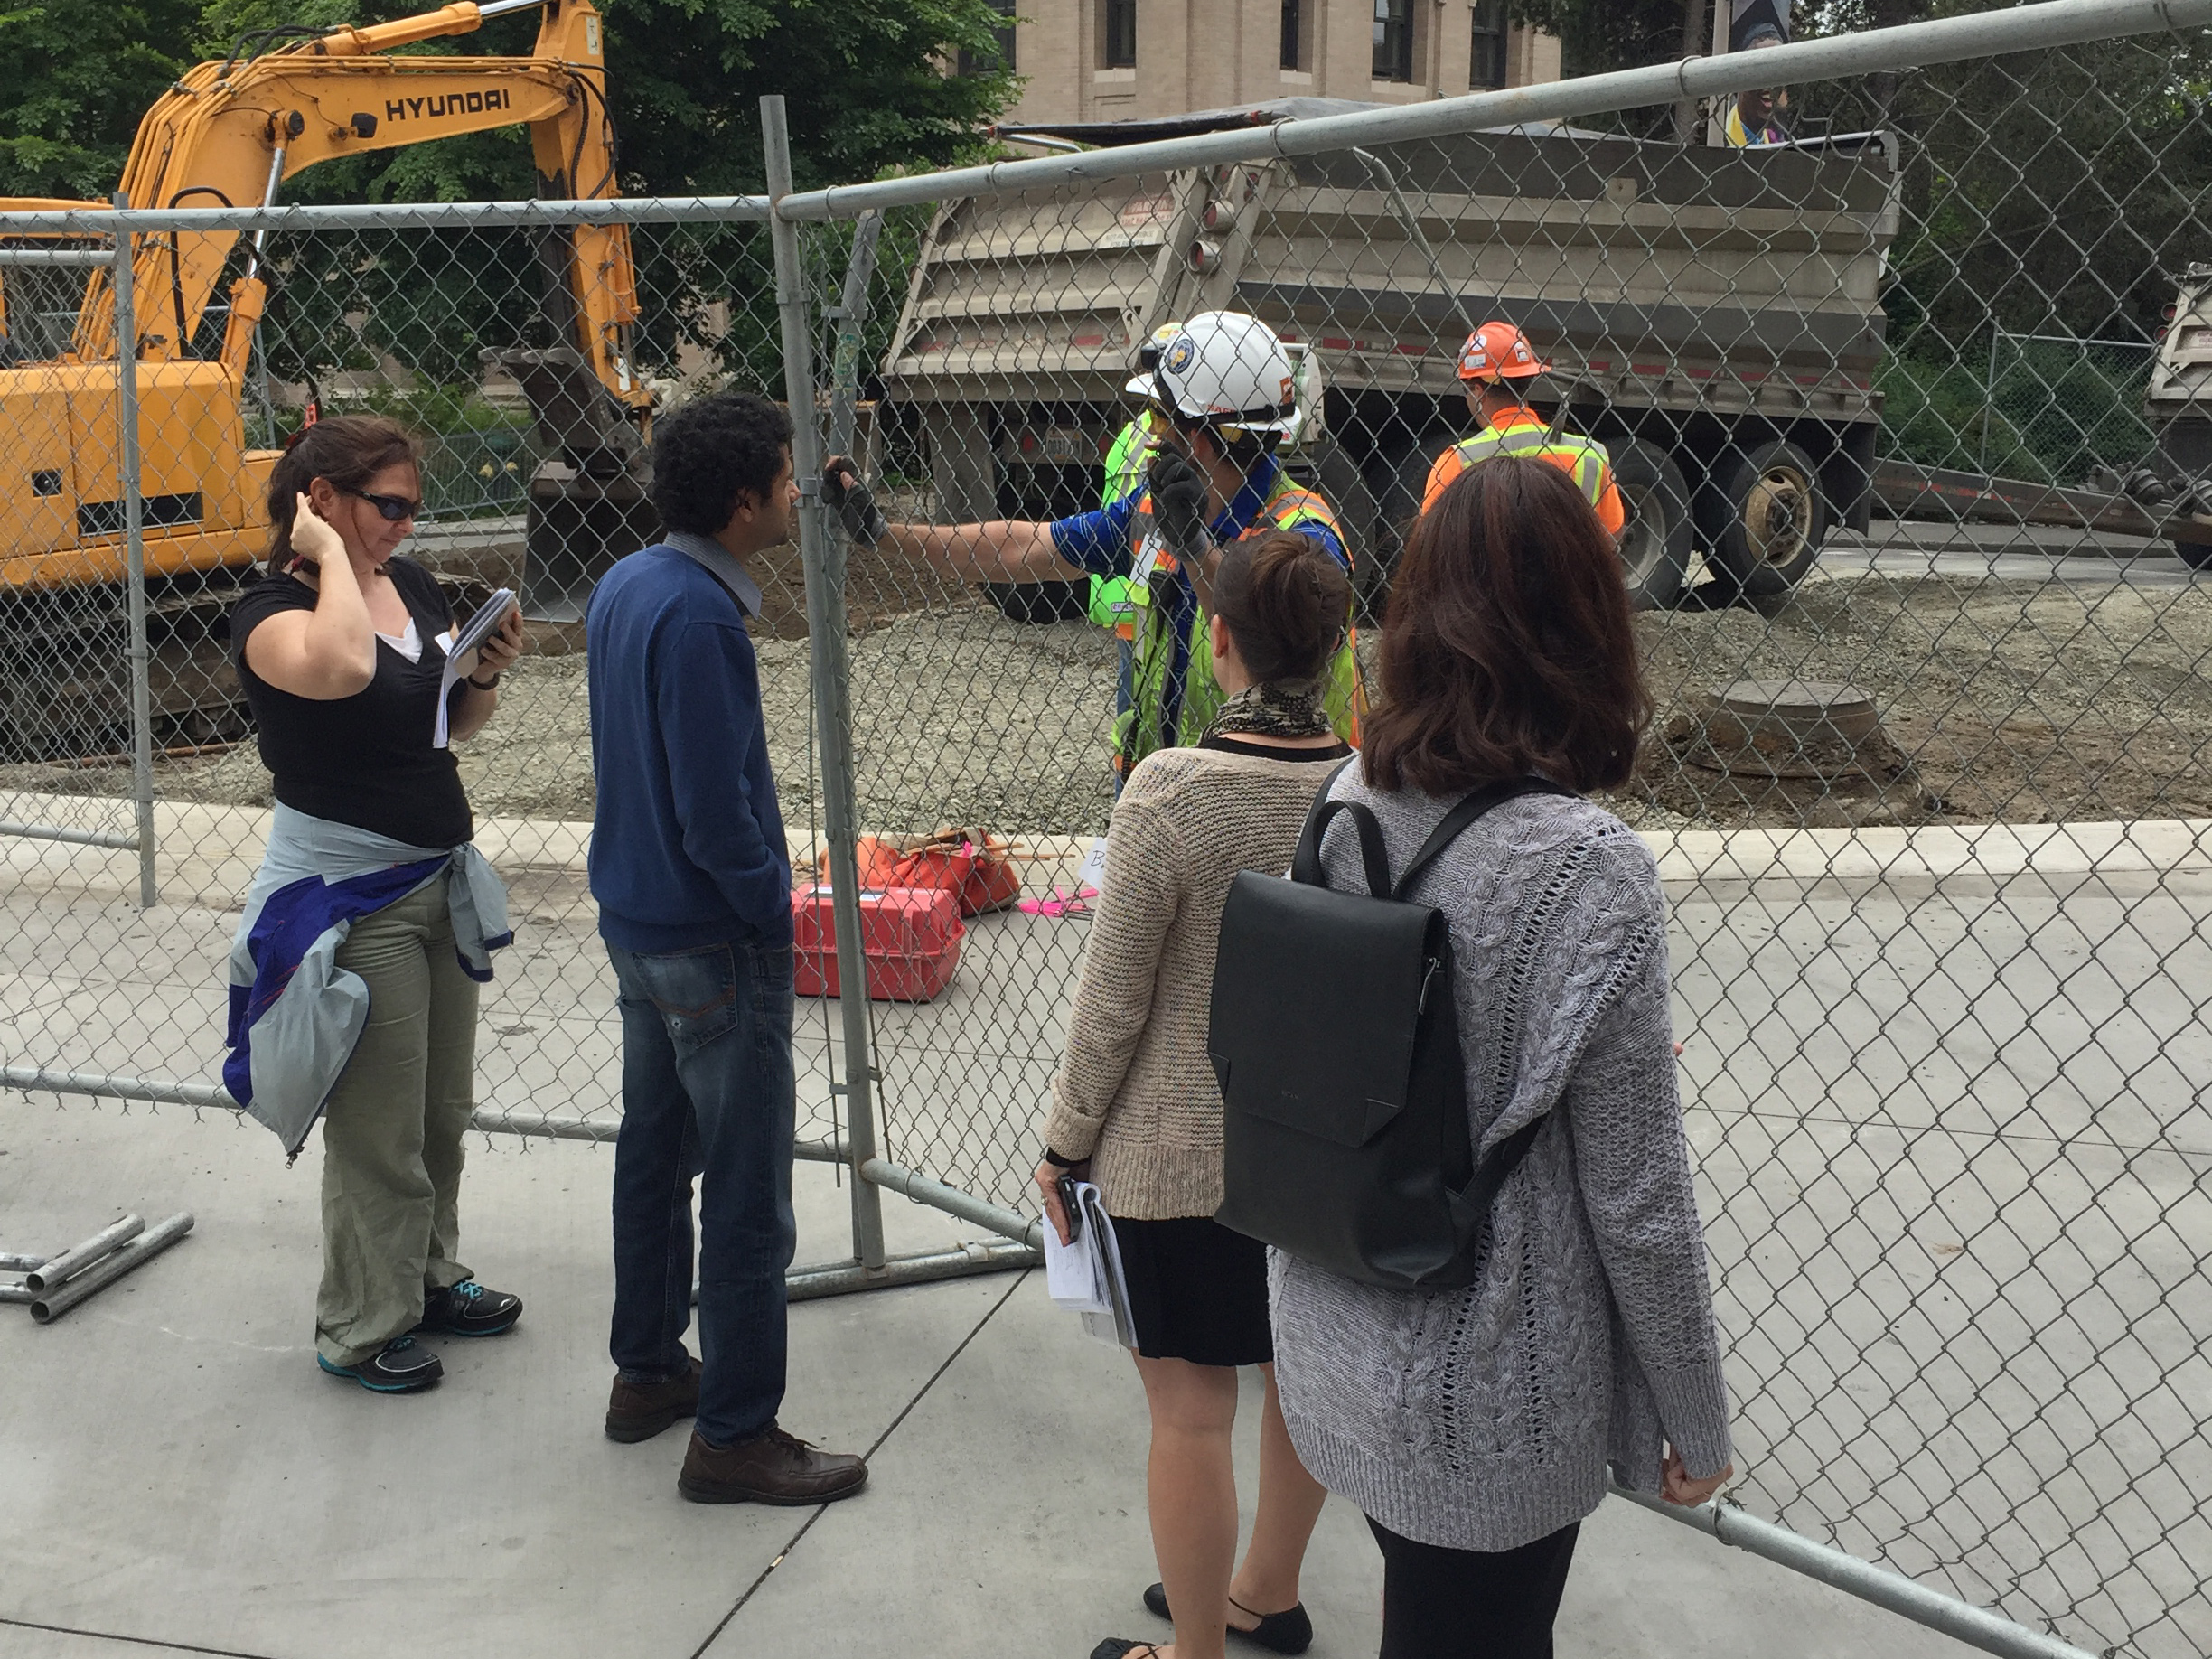
So we set out on our data walk, six budding Data Scientists and adult supervision in the form of Brittany, an ethnographer who also served as backup note-taker. We headed north along Stevens Way, and found ourselves in front of what used to be a glasshouse. After construction, it will be a state-of-the-art Life Sciences department building (or so says the sign). We saw beautiful pictures of a futuristic, modern-looking building imaged on the mesh fencing, which seemed to be an attempt to engage with the community. There was a website mentioned on the fencing, but when we tried to access it, there was nothing there. We saw a sign, “Notice of Proposed Land Use Action”, which had supposedly been put there for engaging stakeholders (there’s an email address to send comments to), but the comment period ended over a year ago. This led us to ponder on the real reason that the sign was still up – possibly to make sure that all stakeholders know that the construction company dotted their i’s and crossed their t’s.
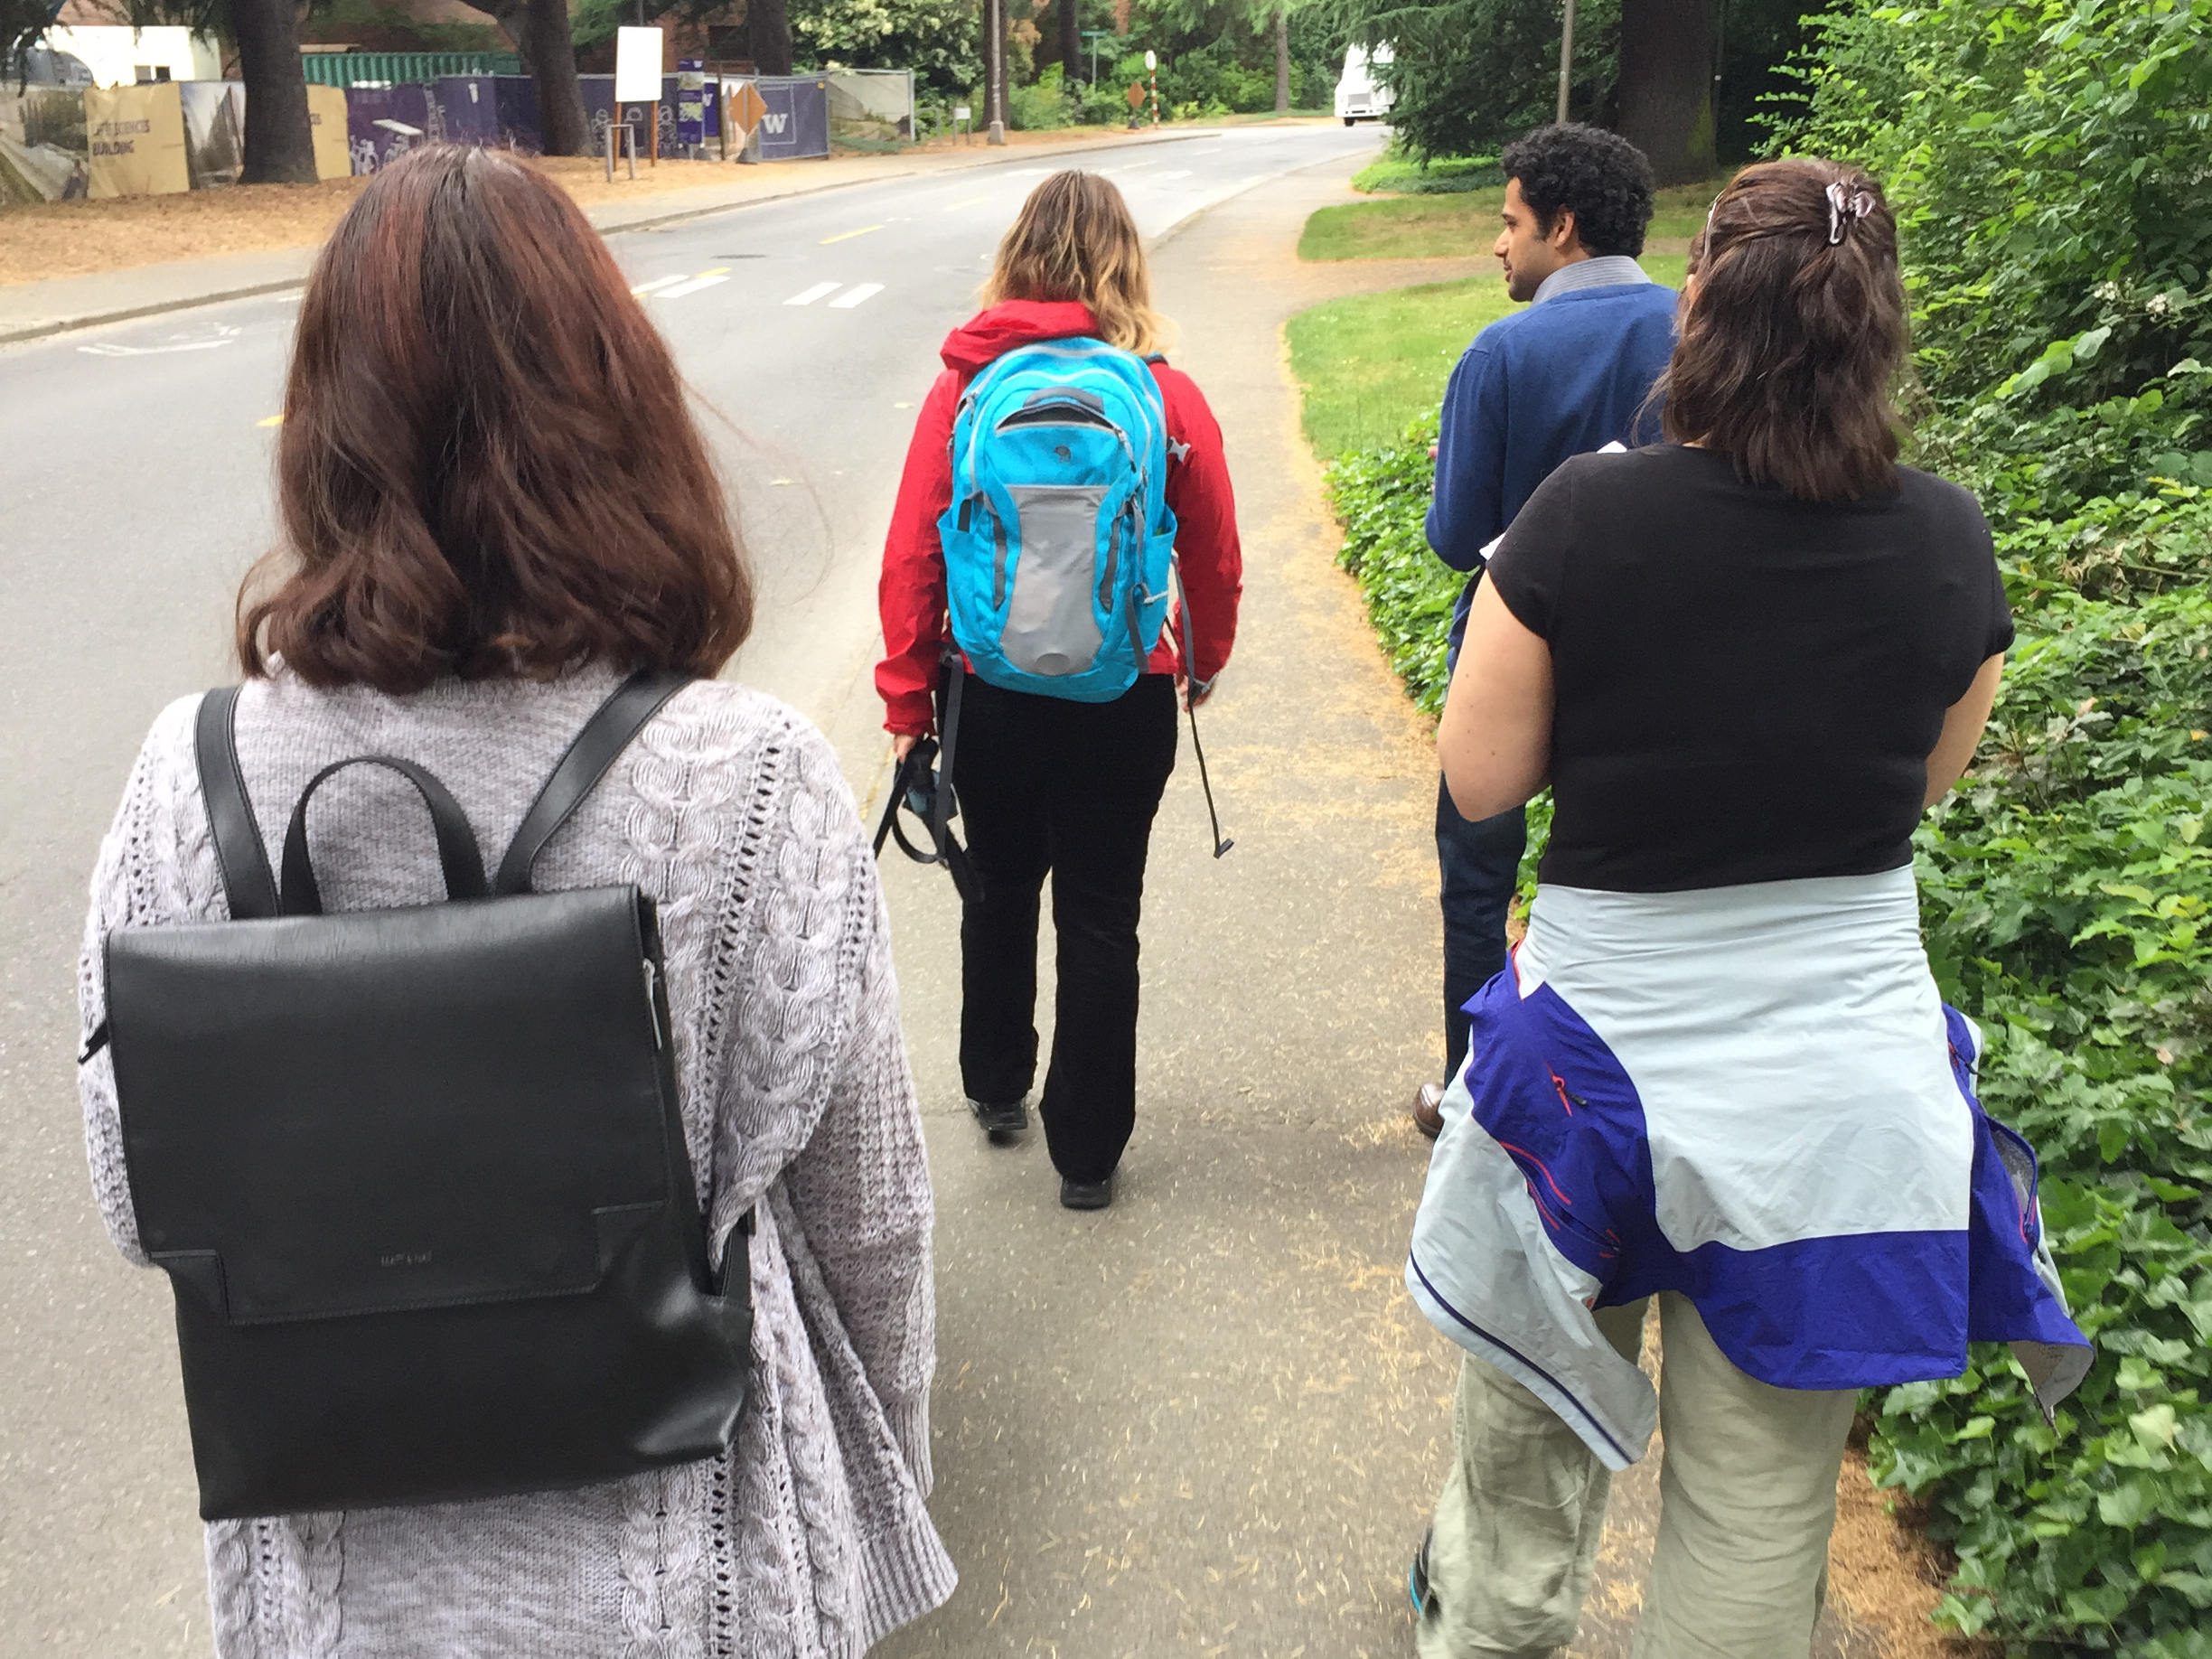
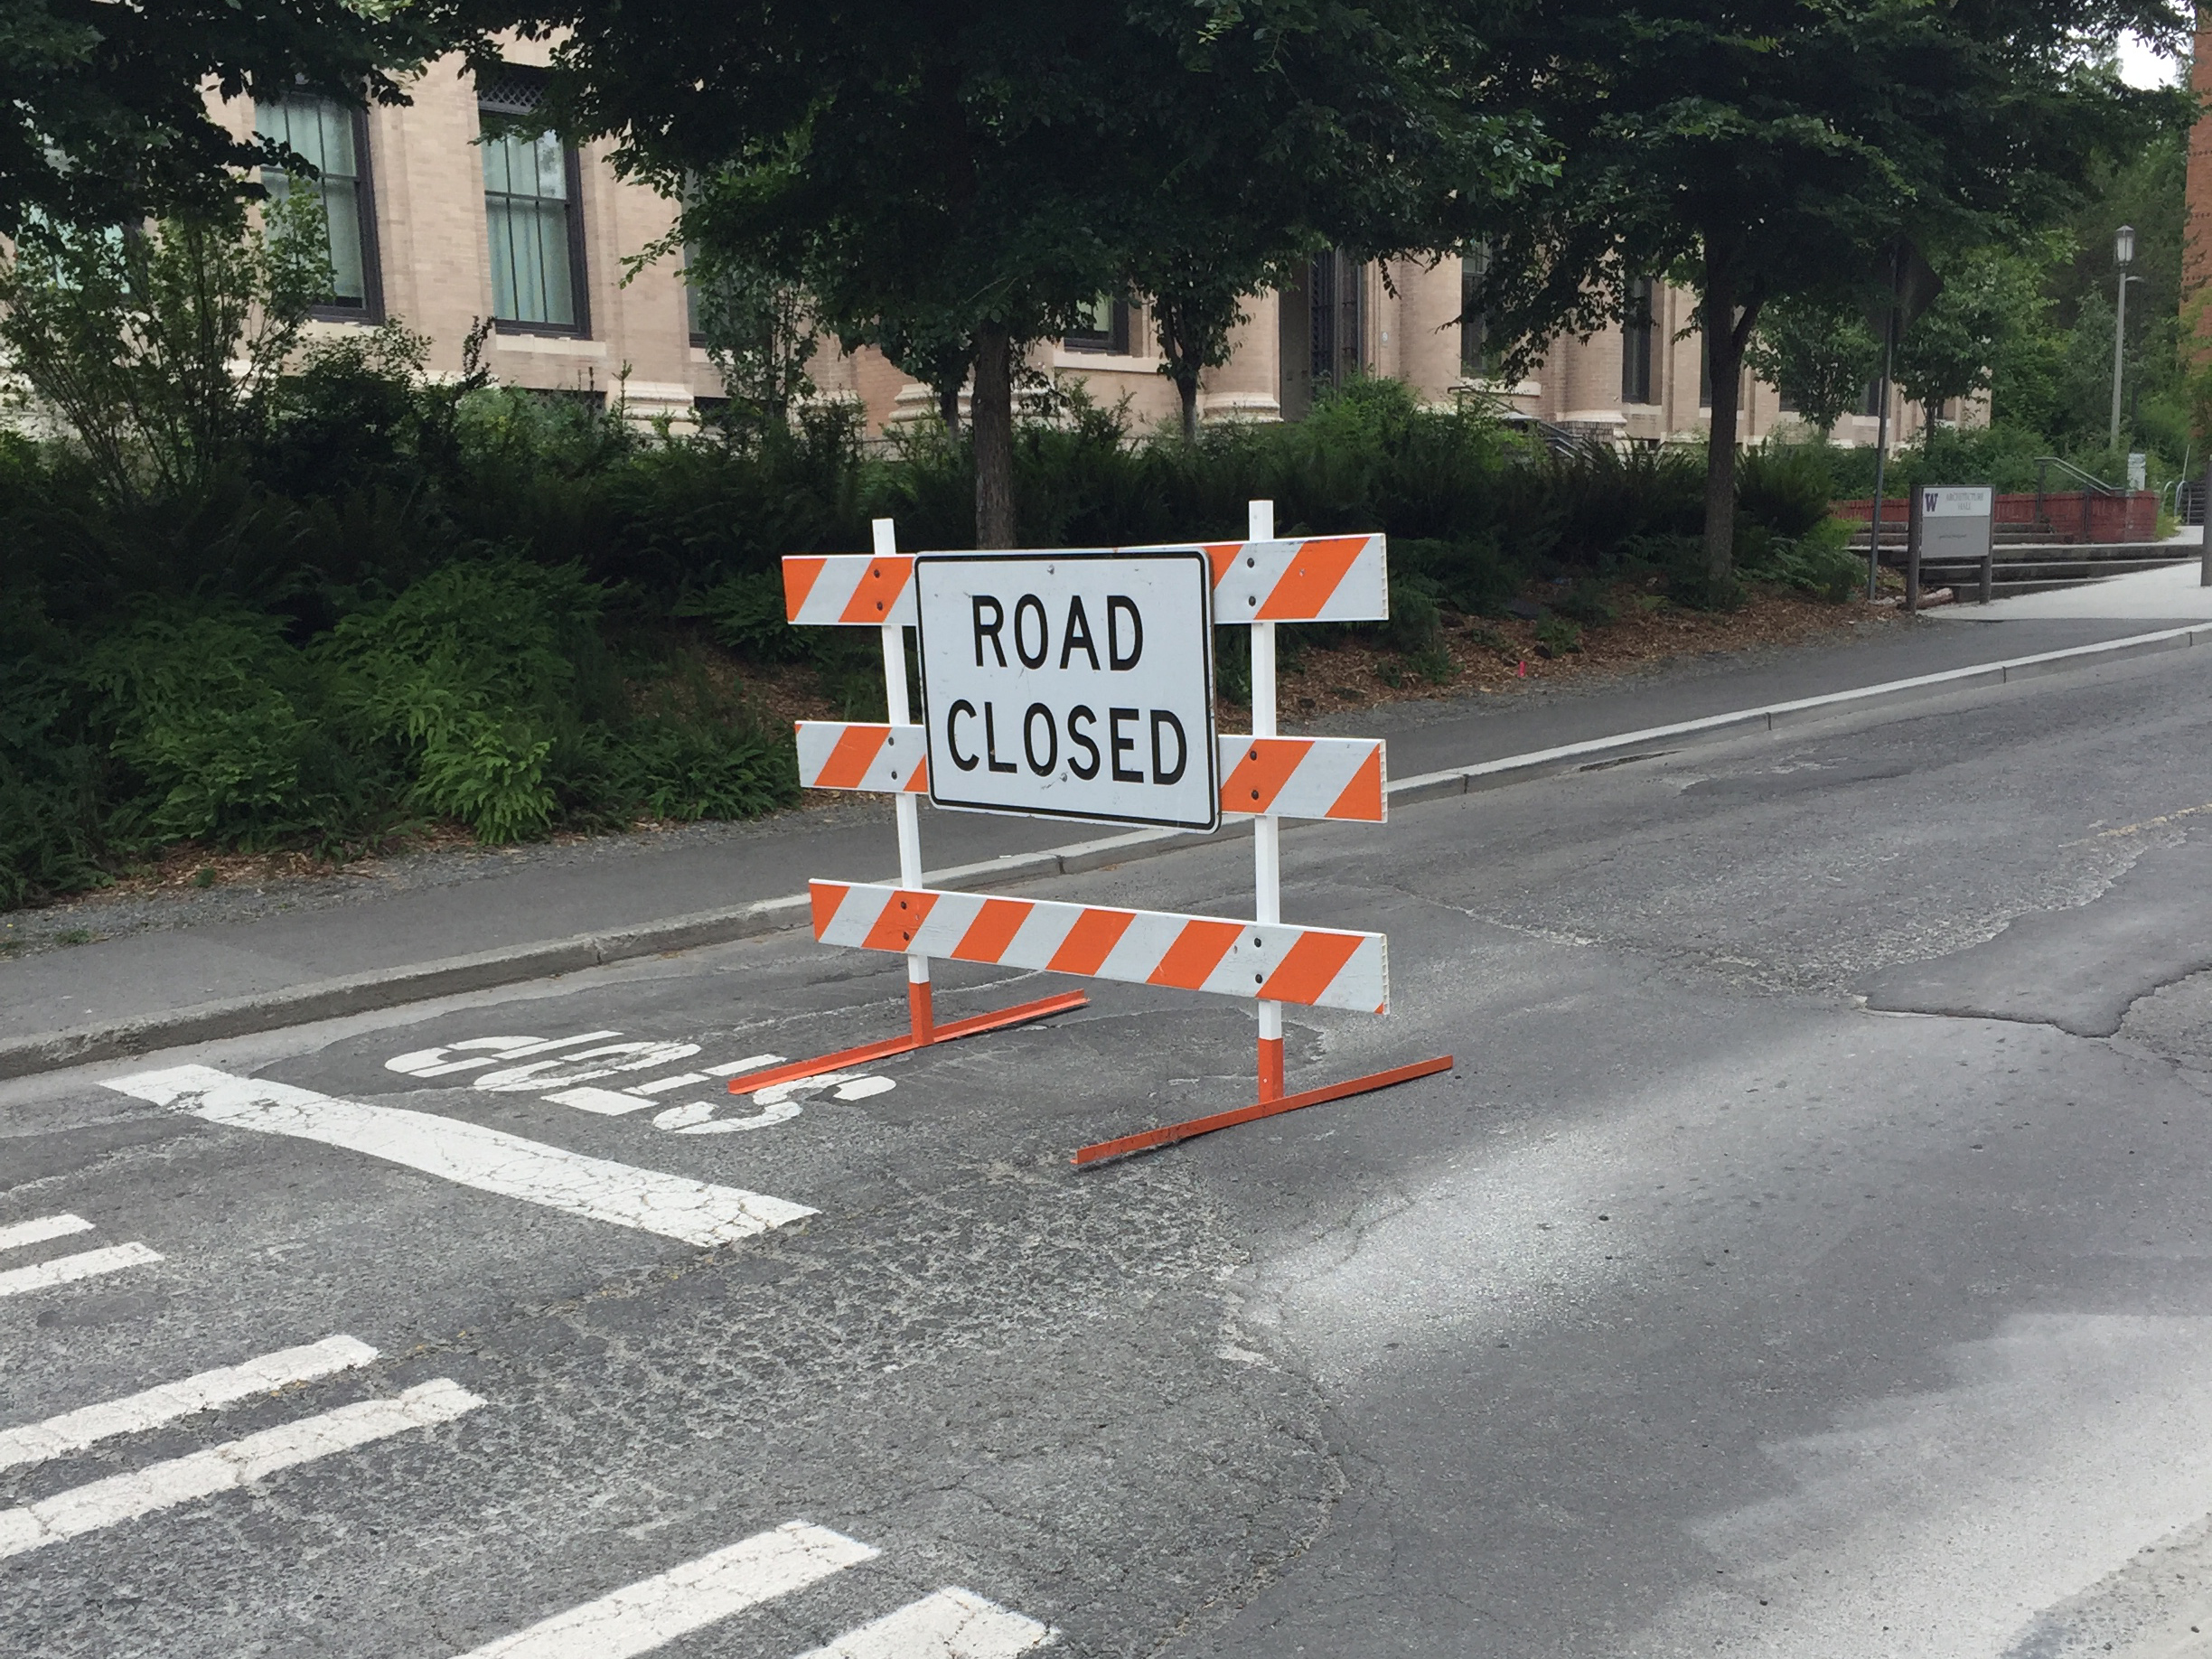
While hanging around at the construction site, we saw a woman hurrying along towards the bus stop with a black lab service dog. We made our way to the bus stop for our very first interview. The woman was reading a sign intently and seemed a little flustered. She also seemed to be in a hurry, so we offered to walk with her. We asked her how she felt about the construction, which gave her a chance to vent a bit. It turned out that her bus route had been disrupted due to the construction happening up the street, and King County Metro didn’t post signs about the re-routes until that morning. She needed to walk all the way to 15th to catch her bus, owing to which she might have missed an appointment. When asked if there was a place she knew that she could air her grievance, she said no.
Our next stop was an intersection actively under construction. In speaking with one of the workers, we learned that it had been an extensive four-month process to determine the optimal timing for the closure and placement/content of signage indicating the work and potential detour options, based on mode of transport (auto, bike, pedestrian). The worker emphasized the extensive discussion between the construction company and the university, and clearly felt that a lot of thought had gone into the whole process. We wondered what “data” would have meant to them and what kinds were considered in the decisions (e.g., intuitive understanding of slow times on campus vs. traffic counts). We observed later that that there was no mention of other stakeholders and how that put the onus of responsibility on the university to represent all the interests of the various groups within their greater Husky community.
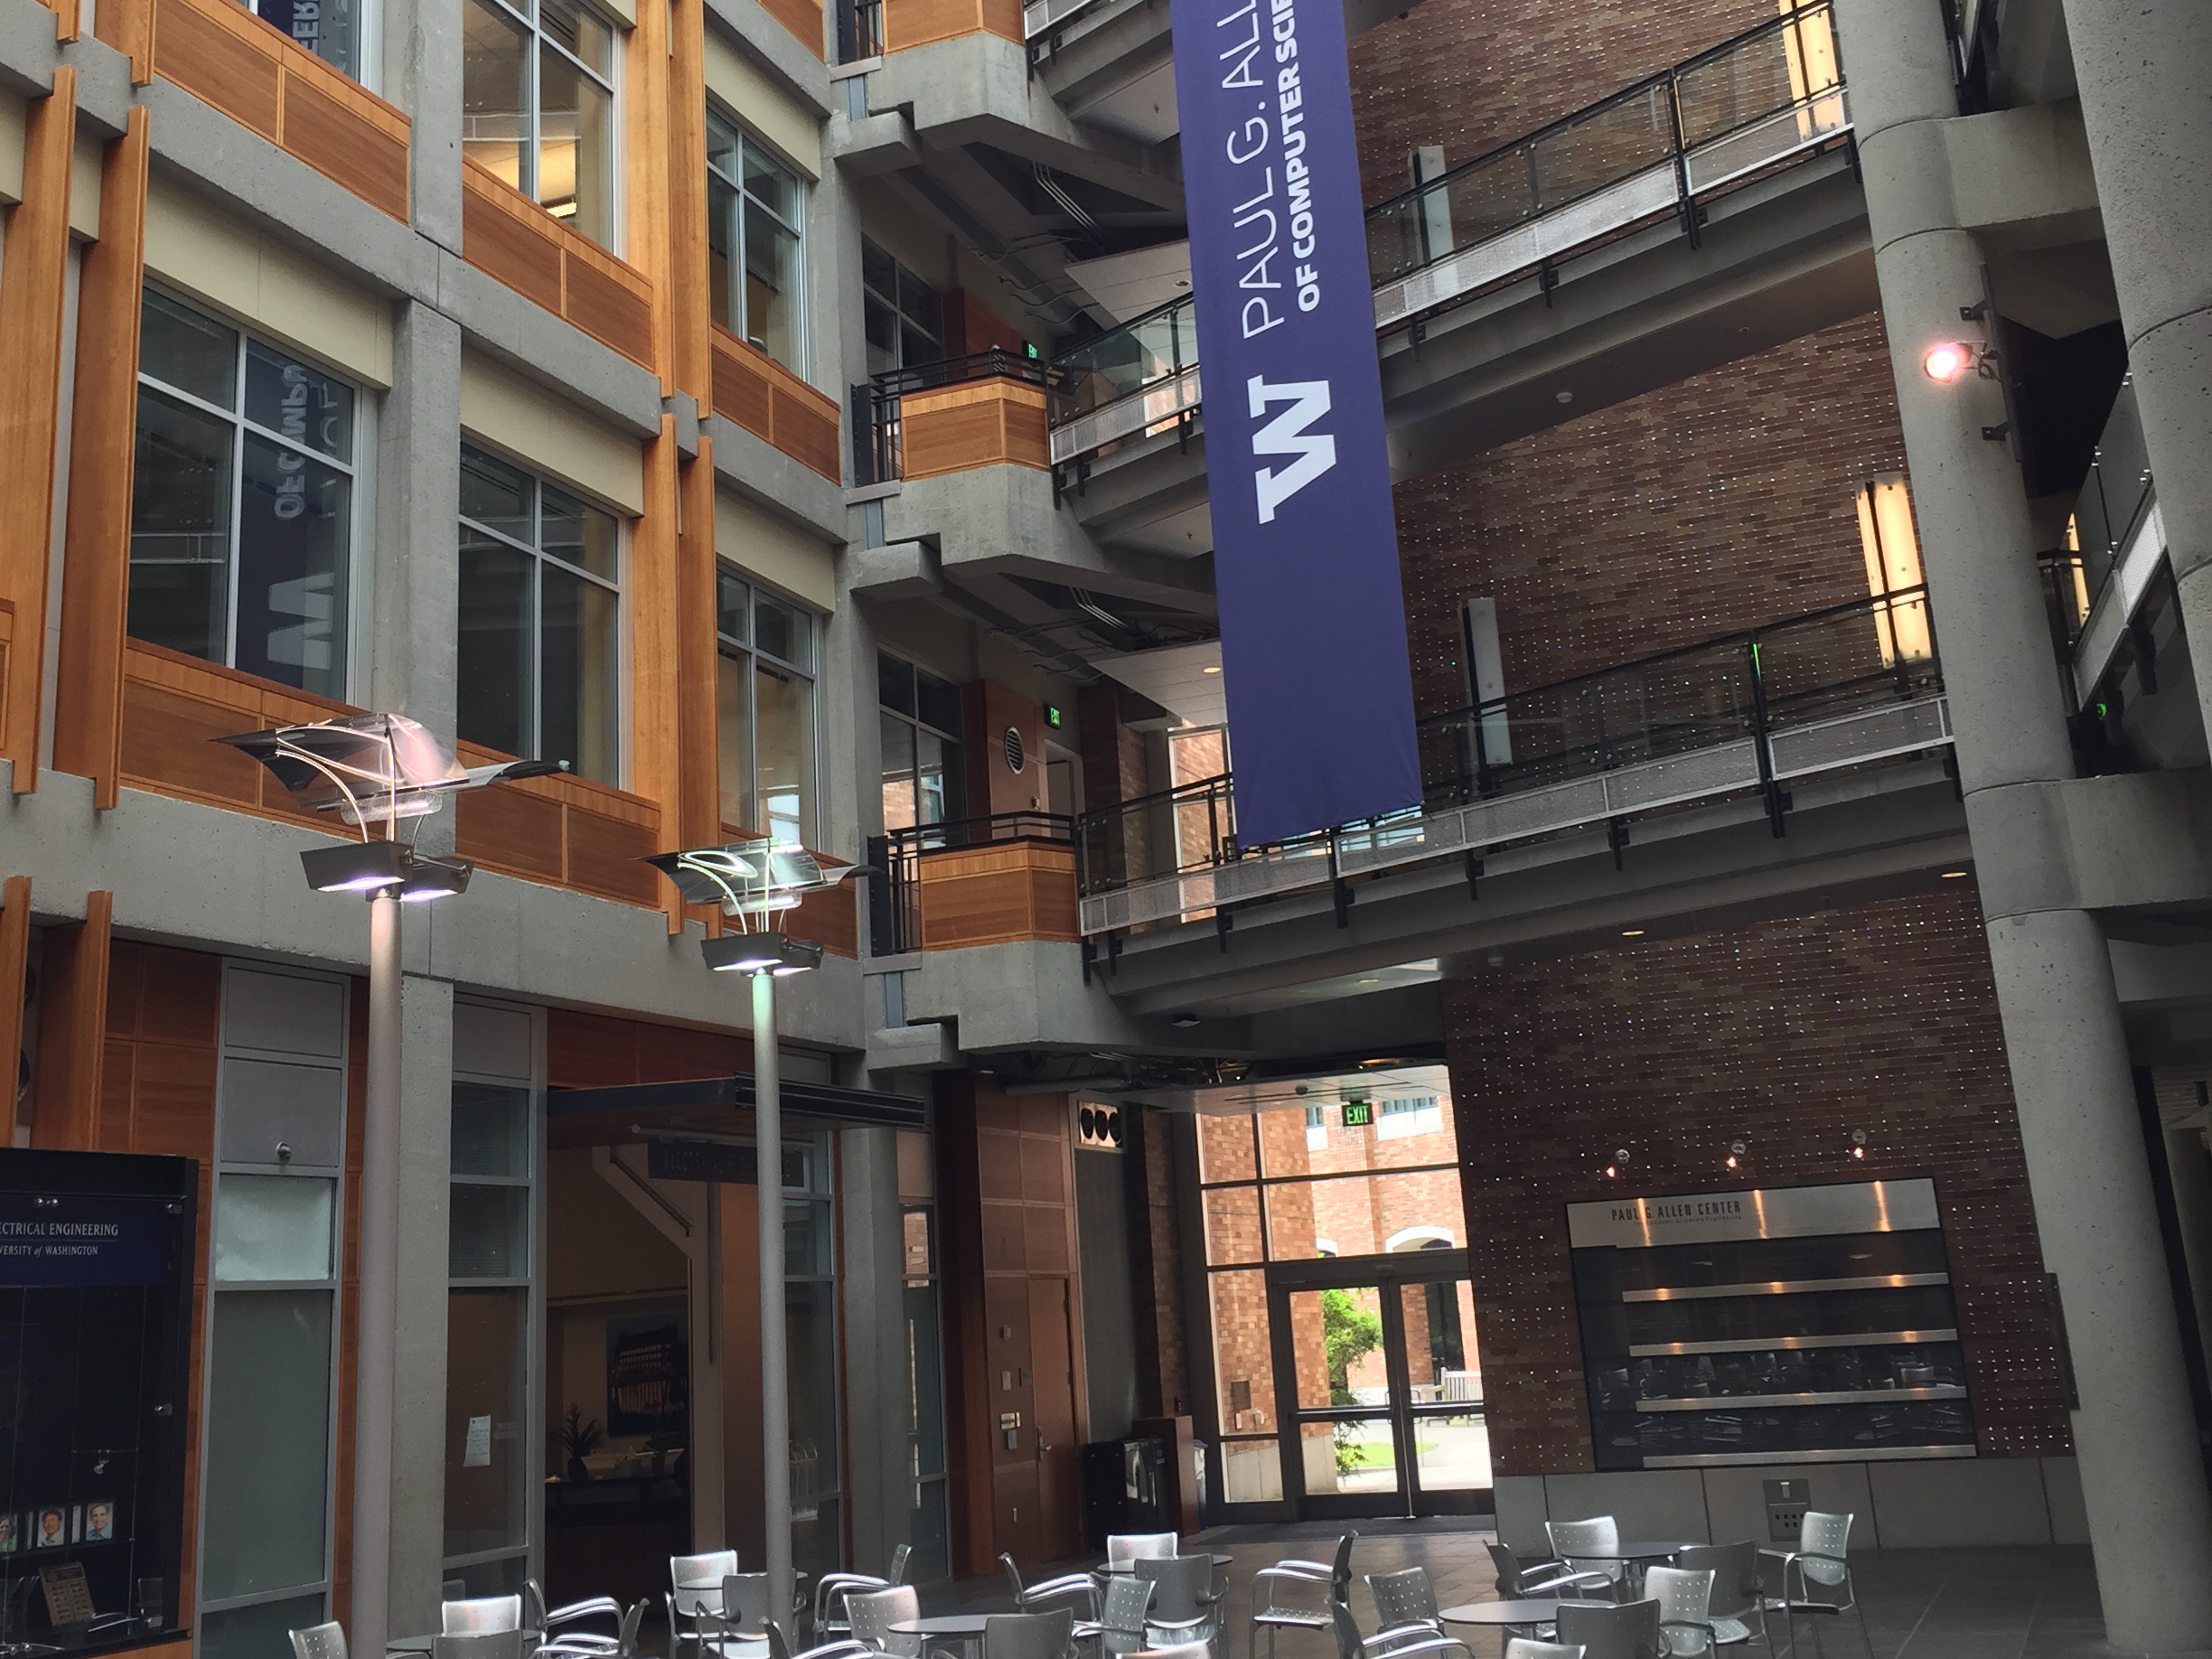
Next, we headed to the Computer Science Department, which is currently constructing a new building on the other side of campus. We spoke to a woman who worked nearby. Initially, she said that the construction really had not affected her that much as people are still coming to the area and visiting her business as usual. However, in hushed tones and almost as an aside, she leaned in and told us that the mobility-challenged individuals had been dropped off pretty far away and were expected to get to the building without any help, making some late for work.
Along the way, we took some conversational detours in addition to the literal ones. As we strolled through the rose garden, Brittany reflected how natural, green areas are the epitome of a data calm environment for her and a break from more common urban environments where there is data everywhere. This was a completely novel perspective to Krista, who is an ecologist who conducts her research in such spaces and sees data everywhere in them. As team members subsequently summed it up: “One person’s data poor is another person’s data rich…we still don’t know about data resistant!”
After an hour spent reflecting on the information content of our immediate surroundings, it felt only natural to apply our new perspectives to the data walk exercise itself. We realized that the confusion we felt when we started was perhaps by-design: if we’d been supplied with more concrete goals, we probably wouldn’t have developed such a broad view of what data is and how people interact with it. Under the circumstances, a lack of data proved more educational than a surplus of it would have been!
Our Takeaways
- Anamol (Interviewer): “Data can often be found in unexpected places.”
- Brett (Photographer): “Data doesn’t always belong in databases.”
- Daniel (Navigator): “Our viewpoints are shaped as much by data scarcity as by the data itself.”
- Hillary (Collector): “Data depends on the observer.”
- Krista (Note-taker): “The best data is not useful if you get it two weeks after you needed it…”
- Wenonah (Map-maker): “Good data is the one get communicated.”
Our Advice (if you are considering a Data Walk)
A Data Walk works as an excellent team-building experience. We had our walk on the first day of our program, and we felt more connected to the group after being through this activity. The Data Walk fostered multiple in-depth conversations that embraced the diversity within a group. Each person actively shared his or her opinion, representing a range of professions and cultures. It built a healthy group dynamic for future work. A Data Walk is not just for people working on data; any people working in social science, urban planning, software development, or any profession involving humans should go on this activity. Firstly, it is an opportunity to think outside the box. Many innovative ideas get generated by pushing ourselves to reflect on the things we get used to and discover the details we ignored. Secondly, for product designers or project managers, going on this walk can help them identify the stakeholders that they fail to take into account and modify the product to accommodate everyone’s need. This encourages a more human-centered design which echoes the essence of their work. Thirdly, taking this Data Walk triggers a sense of urgency to act after identifying the problems. You can come up with millions of benefit, but it depends on many factors. And this becomes the fascinating part of this activity that there is no set thing you will gain afterwards. Thanks to all who made this a great experience!