A data walk on The Ave and the stories behind it
Beginning the Data Walk
Event: a data walk
Time: Jun 12, 2017
Location: University Way (The Ave), Seattle, WA
People: Mayuree, Mike, Mitch, Jacob, Maya and Anissa
The data walk was an interesting experience for us. We had no idea where to begin the data walk and how to search for questions that could help us understand our surroundings in terms of data. As we began the data walk, we first took a halt near the Physics and Astronomy tower and tried to figure out the area in University District where we could walk to gain some interesting insights about it. We all came to a conclusion that the University Way or “The Ave” would be the best area for us to begin with as it’s full of diversity in terms of infrastructure and culture. We began walking towards the University Way. Although , we had chosen the area for our data walk, but 2 minutes into the walk we realised that we did not have a specific data-related question which we could explore. We halted for the second time and brainstormed the kind of questions that we could explore on the Ave. After approximately 2 minutes , we decided to explore the various data related aspects of Homelessness and the various factors affecting data related to homeless population on the Ave.
Unforeseen Perils of Interviewing Strangers
By the time we left 15th Ave, our pursuit was more clear. We were looking for evidence of the forces that lead University Way to be a place of particularly widespread (at least visually) homelessness. Mike set out to glean public perception by interviewing passersby about Tent City 3, a city-sanctioned residence recently in place just south of University Way. Here came the first surprise of the walk, at least to Mike, as he tried and failed repeatedly to garner so much as a passing glance from pedestrians. Perhaps it was his lack of a clip board, or his bland opening line. Or maybe his credibility suffered from the appearance of his name tag, which read simply “Mike” in black Sharpie. In any case, the data were not exactly flowing in, and he offered up the interviewer role to someone better equipped or better looking. Maya was kind enough to relieve him of his shame.
Police Encounter
As we turned down the Ave, we ran into a group of bicycle cops having a conversation with a group of homeless people. We thought we would make the most of our natural rubbernecking response, and see the “data angle” in this conversation. What could we learn about data from a few cops chatting with homeless people (the cops left shortly, after giving us a sardonic wave as Mitch took pictures)?
Mitch immediately thought to understand this through the prism of a research question. What if we were working on a project involving homelessness in Seattle? Well, our data might consist of arrests for vagrancy, which are typically released to the public. So the concept we’re curious about is homelessness, and the data we might use are arrests for homelessness. But the concept and data don’t quite add up, and the interaction between cops illustrates why — not all interactions with cops result in arrests. We can only guess the reasons (the mood of the police officers, how polite the homeless people are, the time of day, whether or not people are watching etc.), but each of these potential factors is a potential source of bias in any future analysis.
Stories heard in the data walk
To get an idea of how people perceived the safety on the Ave, Maya interviewed a pedestrian, who turned out to be a retail business owner. His direct response to the safety question was that, considering the church is offering a shelter to homeless people, it’s not surprising that homeless people would stay around the area. We also had a conversation with him about the meaning of “good”. In his opinion, solutions that offering a shelter to homeless people, was indeed not a solution for “good”, in the sense that this would enable homeless people to continue behaving badly, which was bad for both themselves and also others. Another interviewee was a homeless person on the Ave, offering us some voice from the other side. He told us a story between him and the owner of a convenience store, that once the convenience store was robbed and a couple of the homeless people chased the perpetrator down. He also told us that most of the old business owners disliked homeless people like him, because they thought these people were not behaving well, which to him, was actually a free way of living that he enjoyed a lot. The interviews prompted a discussion among the team regarding the concept of social good. What does social good mean? For whom are we trying to make it good? In this case, is it interfering to have no homeless people, or offering shelters to them, or leaving them alone to their own life?
The interviews prompted a discussion among the team regarding the concept of social good. What does social good mean? For whom are we trying to make it good? In this case, is it interfering to have no homeless people, or offering shelters to them, or leaving them alone to their own life?
The Tree of Hope Past
Our walk ended with a visit to the “Tree of Hope”, a public art project erected by University Temple United Methodist Church and resembling other trees scattered around the city. I had passed by the tree when it was in full glory, its branches covered by dozens of little cards with prayers and wishes scrawled on them. I thought we might see some interesting grassroots data but we found only a forlorn skeleton, stripped nearly bare by Seattle rain:

The most obvious lesson here is the fragility and ephemerality of data. Preserving data—digital or otherwise—is a challenging task that requires institutional support and ongoing curation; data needs care and feeding. But we also considered the Tree of Hope in light of University Temple’s many homeless outreach programs and its many signs and banners of welcome, standing in sharp contrast with prominent, official signage outside the post office merely one block away:

The most obvious lesson here is the fragility and ephemerality of data. Preserving data—digital or otherwise—is a challenging task that requires institutional support and ongoing curation; data needs care and feeding. But we also considered the Tree of Hope in light of University Temple’s many homeless outreach programs and its many signs and banners of welcome, standing in sharp contrast with prominent, official signage outside the post office merely one block away:
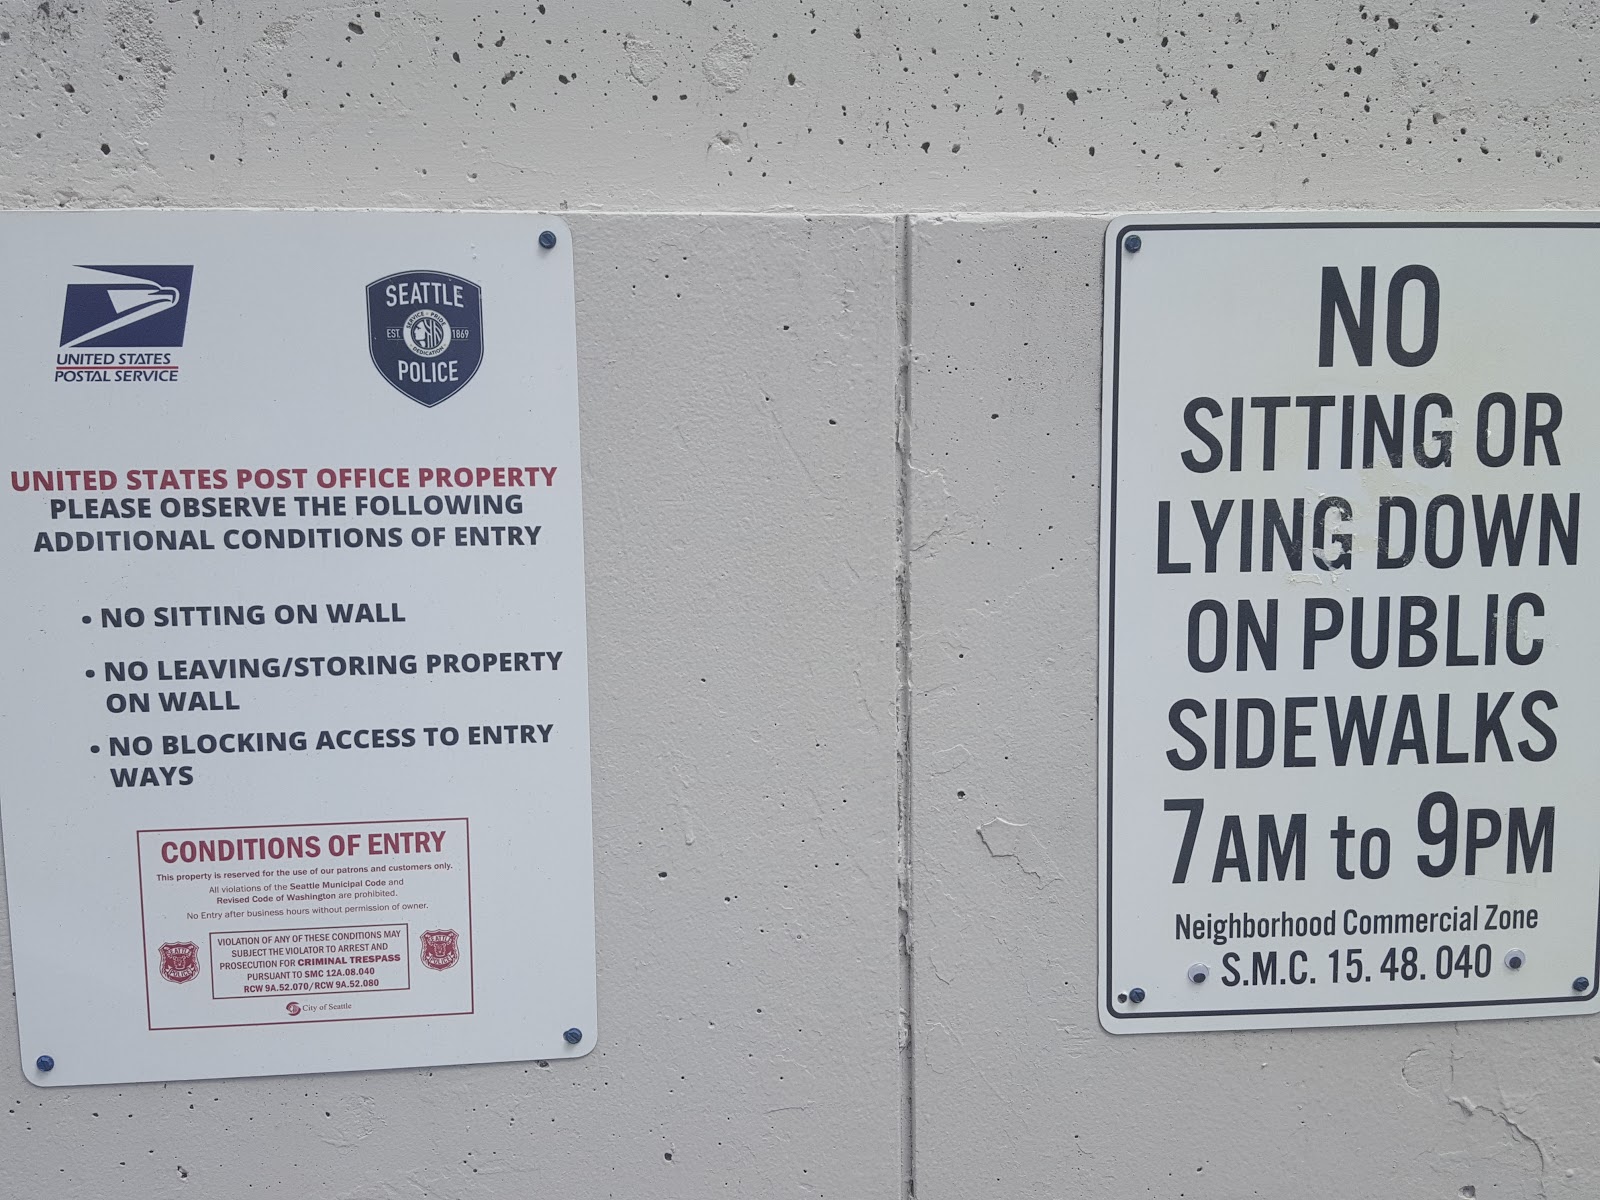
Given this broader context, we thought of the Tree of Hope as a symbolic gesture welcoming the voices of marginalized community members. This made the tree’s demise doubly sad.
Making your data walk worthwhile
Reflecting on the value of the experience overall, our group had a few thoughts (based on trial and error!) about how to get the most out of a data walk.
The eScience Institute’s resident anthropologists had prepared us for the data walk by asking all the DSSG fellows to share their definitions of “data science for social good”, then synthesizing our responses into several major themes. Even though we self-selected into smaller groups based on themes that interested us, we found ourselves floundering at the beginning of the walk. It wasn’t until we latched on to a specific research question/issue (homelessness) that we gained a sense of direction. We noticed a similar shift from theme to issue in presentations given by the other data walk groups. Our advice is to be prepared for some initial confusion as the group negotiates their different understandings of the purpose of the walk; second, to head in a direction that seems likely to be data rich, giving your group plenty of material to work with; and third, to look for a question or issue that can emerge from the location and give a stronger sense of direction to the rest of the walk.
Conclusions
Despite our clunky start and the fairly short time we spent walking around the University District, our group had several insights that changed the way we might approach a study of homelessness in Seattle. We realized data related to the drivers of homelessness might not come from places where it is most visible, and that some types of relevant data are not regularly recorded (like uneventful police encounters with homeless residents) and must be directly observed or crowdsourced. Mike and Maya’s interviewing (mis)adventures also illustrated in a very overt way the fact that the identity, disposition, and outlook of an analyst can influence the data that are acquired. For us, experiencing data in this embodied way enriched our conversation and helped us think about how we might approach our projects this summer.