ds4ad
Plotting using matplotlib
This module will cover plotting basics using the matplotlib.pyplot API and plotting with pandas data frames.
The Jupyter Notebook will render plots inline if we ask it to using a “magic” command %matplotlib.
import matplotlib.pyplot as plt
import pandas as pd
%matplotlib inline
Let’s create a fake data frame that we will use to explore the plotting functions.
df1 = pd.DataFrame({'time': [0, 1, 2, 3, 4, 5],
                    'distance': [0, 100, 200, 300, 400, 500]},
                  index=[0, 1, 2, 3, 4, 5])

df2 = pd.DataFrame({'time': [0, 1, 2, 3, 4, 5],
                    'distance': [500, 400, 300, 200, 100, 0]},
                    index=[0, 1, 2, 3, 4, 5])
Plots from data frames are then (fairly) simple to create.
plt.plot() provides us with a canvas that we can begin adding to!
plt.plot()
plt.plot?
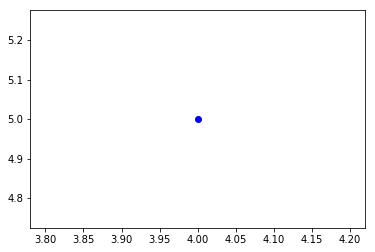
At the minimum you need to fill in some of the parameters that correspond to plt.plot, like x and y, and the line style or marker.
plt.plot(4,5, marker = 'o')
Working with pandas data frames
matplotlib.pyplot can handle pandas data frames directly.
You can use indexing by name directly.
plt.plot(df1['time'],df1['distance'])
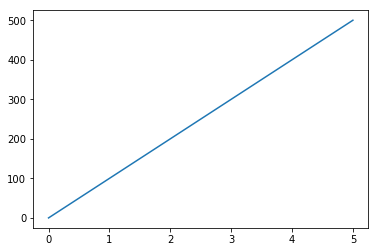
or
plt.plot('time', 'distance', data= df1)

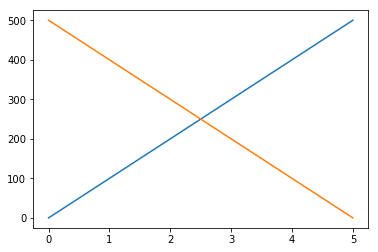
You can add multiple plots by adding more plt.plot()
plt.plot('time', 'distance', data= df1)
plt.plot('time', 'distance', data= df2)