Colorado
Focus
New state-specific requirements have emerged for the 2020 redistricting cycle that require additional examination before real-world application. In 2018, Colorado voters approved Amendment Y which added new language to the state constitution that requires the consideration of political competitiveness in the redrawing of Congressional district maps.
The goal of the following case study is to define and implement a measure of political competitiveness relevant for Colorado’s redistricting context. Part of this exercise will require us to wrestle with differing views on how to quantify political competitiveness. We add a layer of complexity by also prioritizing the minimization of county splits in all proposed plans to illustrate the way decision-making trade-offs operate within redistricting rules. The use of GerryChain allows us to generate an ensemble of potential maps that are constrainted by the state’s unique redistricting criteria and political geography.
State Context
Colorado’s requirements for the redistricting of Congressional districts is established in state constitutional provisions that outline the composition of the Colorado’s Independent Congressional Redistricting Commission and the requirements for the redrawing of district boundaries. There are six core requirements for a proposed redistricting plan, organized along a hierarchy of priority:
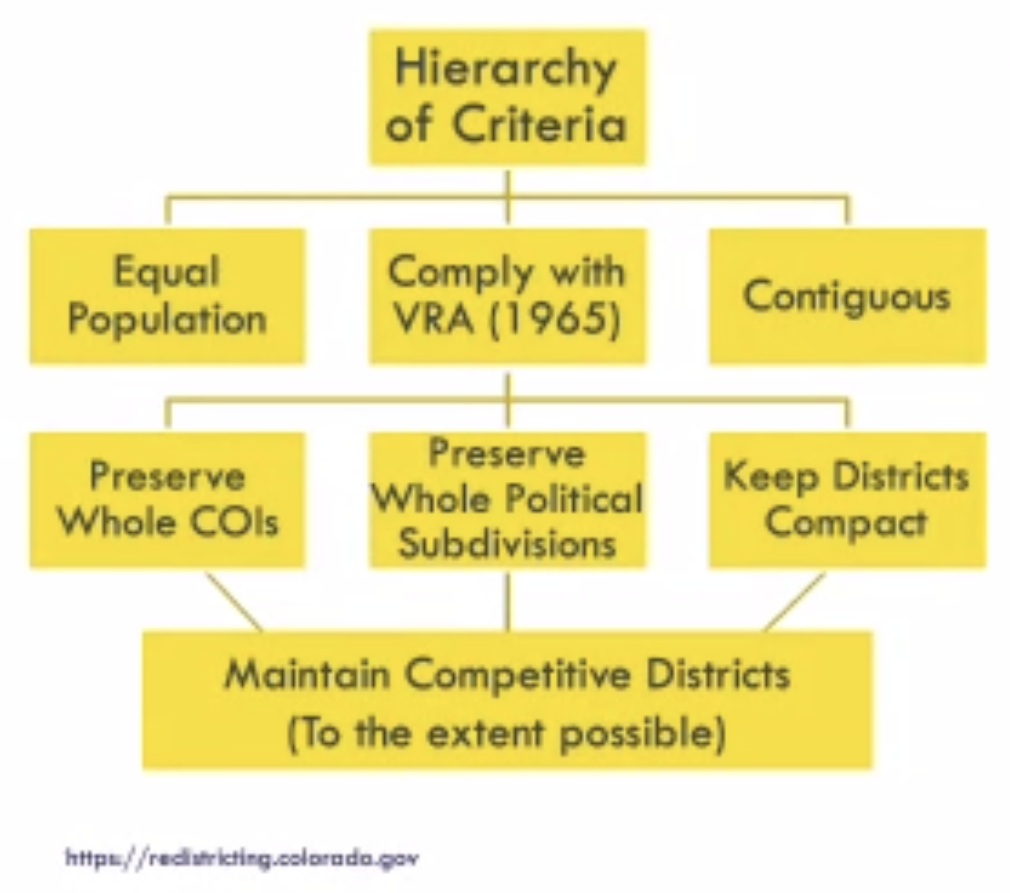
The application of political competitiveness is especially challenging under this hierarchical criteria structure. That is, not every criterion is treated the same. In fact, the most important level of the criteria outlines proposed maps must include equal population, compliance with the Voting Rights Act of 1965, and for all districts to be contiguous. After this first level of criteria is achieved, then maps should preserve whole communities of interest, preserve whole political subdivisions (e.g., county lines), and to keep districts compact. Only after these previous six requirements are satisfied does the redistricting commission consider political competitiveness.
Political Competitiveness
Political competitiveness can be examined through two distinct bodies of work. Since the inclusion of the political competitiveness language will be relevant for the 2020 redistricting cycle, several papers from mathematicians have recently been published exploring this question in the multiple state contexts. Additionally, political scientists have theorized and tested their own measures of political competitiveness, broadly in relation to voter behavior and partisan politics in single member districts. However, despite this rich research literature, there is no prevailing agreed upon standard on how to best quantify measures of political competitiveness.
After reviewing the literature and examining field-specific consensus, we focus our definition of political competitiveness through the vote band method. Clelland et al. (2021) and DeFord et al. (2020) both investigate political competitiveness using GerryChain, and conclude that a vote band of 45-55% is the simplest starting point. The vote band method has also been adopted by other organizations such as the 538’s Redistricting Tracker and Princeton Gerrymandering Project’s Report Card (Note: the Princeton Gerrymandering Project uses a narrower band of 46.5-53.5%)
Clelland et al. state that “a district is considered competitive if Democrats and Republicans both receive 45% to 55% of the combined Democratic and Republican votes (votes for candidates of other parties are not considered)… and [the vote band method] requires the fewest assumptions and will be most satisfactory for [their] analysis” (p. 13). We too adopted a vote band method of 45-55%, although we acknowledge that Colorado’s language to “maximize politically competitive districts” is highly interpretable and can take many additional angles. We chose to start with a more generous 45-55% band to maximize the number of competitive districts in our proposed maps.
Case Study Results
There are two significant challenges inherent to this Colorado case study. First is Colorado’s hierarchical criteria structure, which requires the balanace of multiple conditions before attending to political competitiveness. Second is the ambiguity of the concept of political competitiveness itself. Therefore, our case study will specifically describe the decision-making trade-offs on how to draw maps that maximize the number of political competitive districts while also minimizing county splits within the same map.
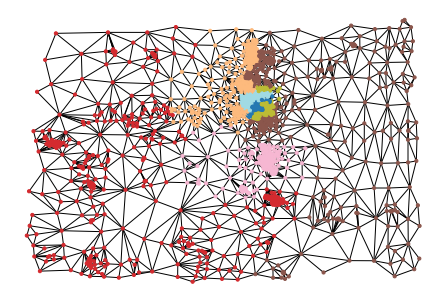
In the past 5 US House elections in Colorado using the 2012 map, only 1 of the 7 districts each year was considered competitive. Using GerryChain and Colorado’s 2018 U.S. House election results, we specifically designed the Markov chain to only accept next steps in the chain that contain plans with both a greater or same number of competitive districts and fewer or the same number of county splits. We ran the chain for 20,000 steps and then graphed the number of competitive districts contained in each plan explored. We documented our model in a Jupyter notebook and final GerryChain script.
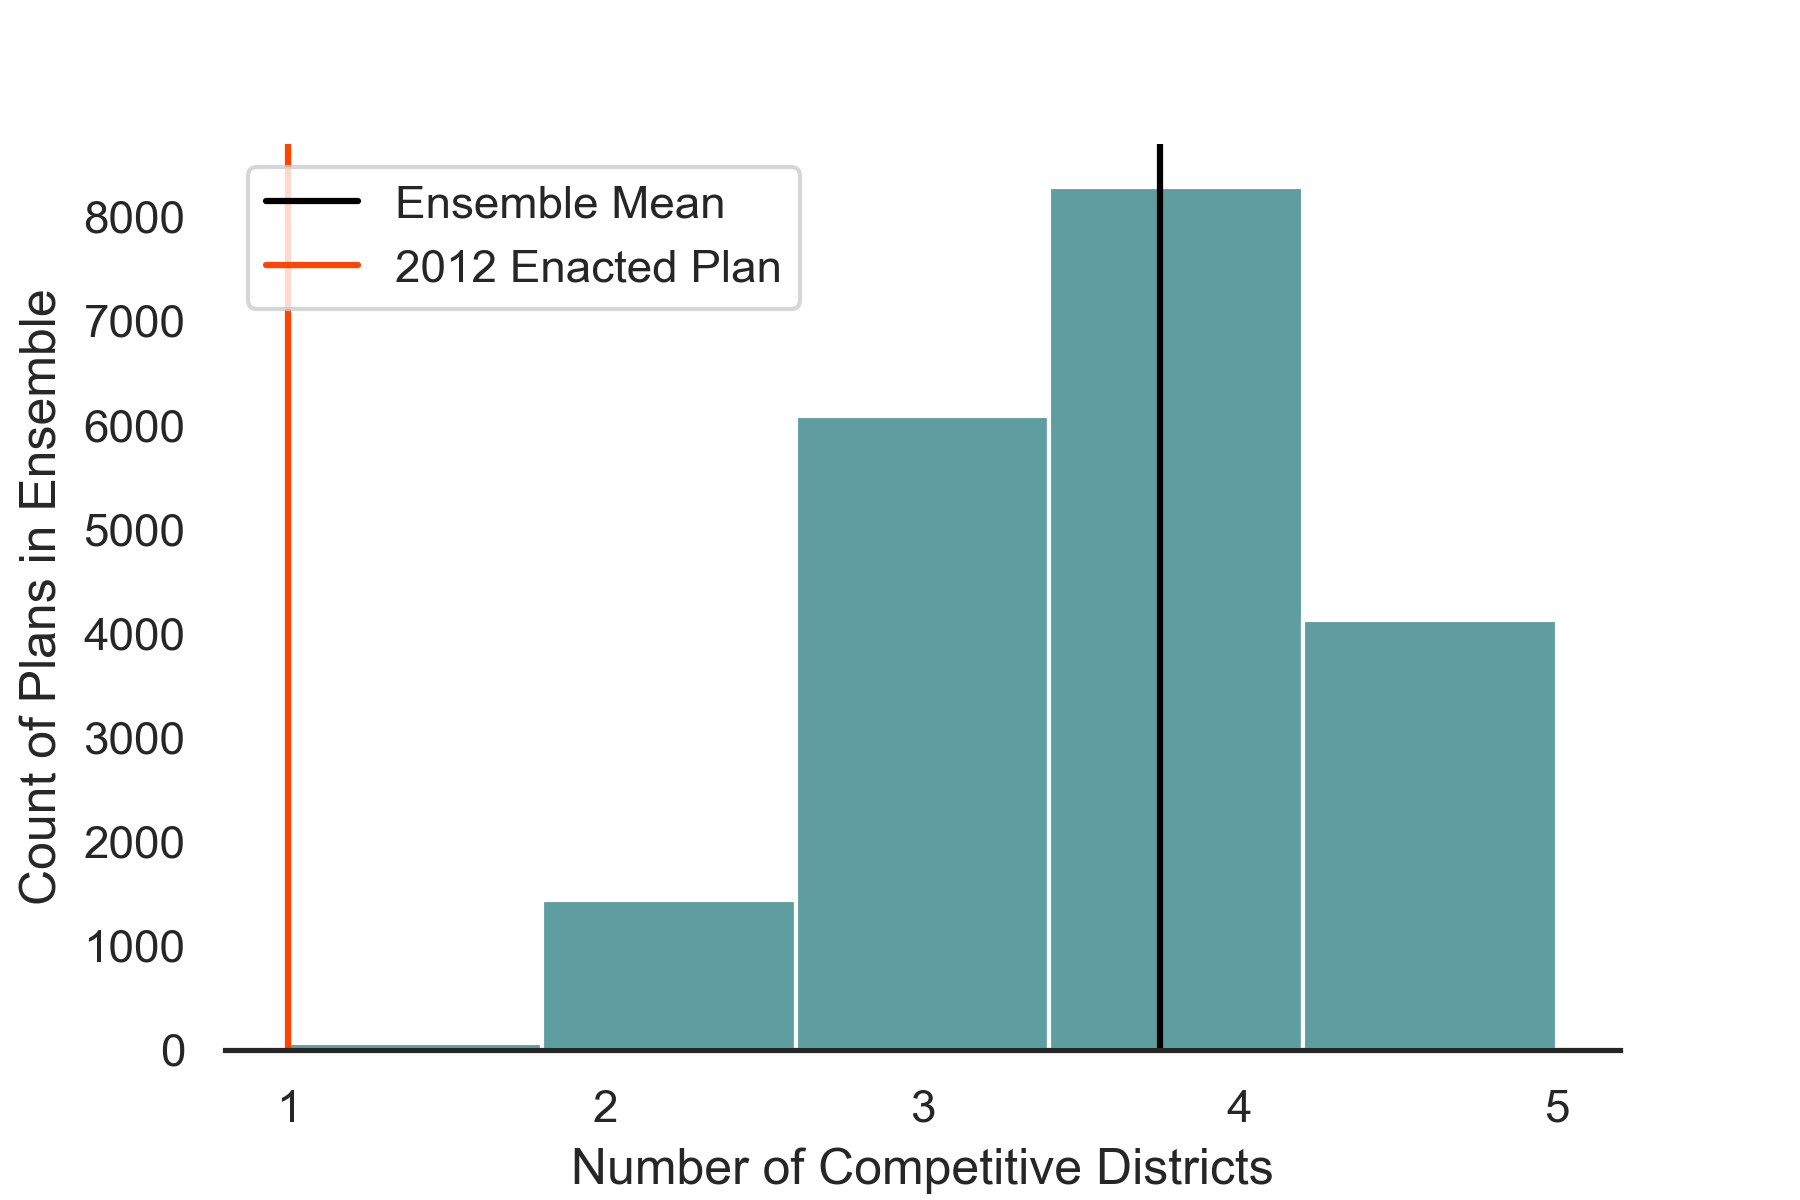
After running the model, we conducted an outlier analysis using a histogram to examine how the 2012 Congressional plan compares to the ensemble distribution. Results show that our ensemble mean is 3-4 districts (specifically, 3.75), which is 2-3 districts more than the 2012 human generated plan.
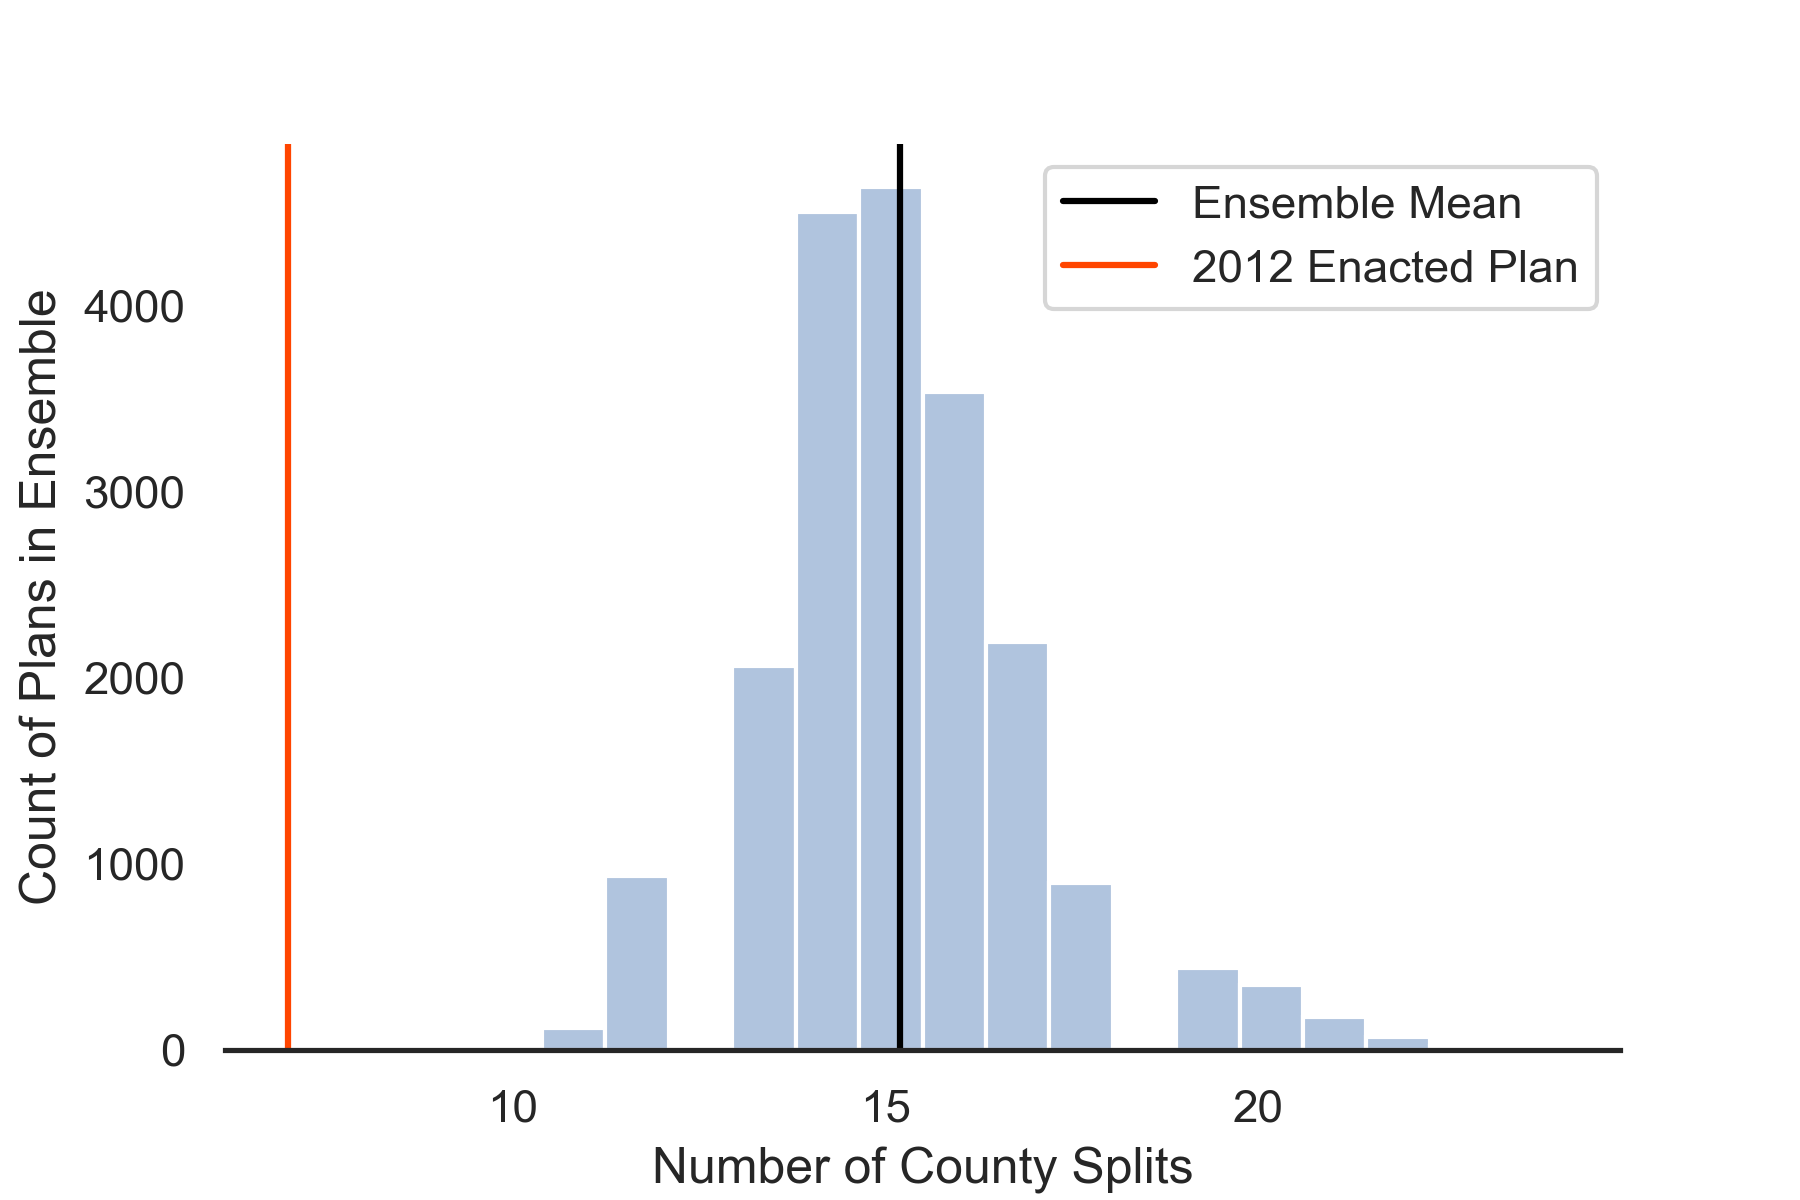
However, our neutral ensemble did not generate proposed plans that met the number of county splits in the 2012 enacted plan. Even though we applied a county-aware ReCom proposal and an acceptance function with a county split condition, our ensemble mean is 15 county splits while the 2012 human generated map only split 7 counties. This illustrates the complexity that emerges when using ensemble analysis and computational tools to translate legal rules for redistricting. While the 2012 enacted plan was able to minimize county splits to a degree that our ensemble did not, the same plan did not maximize politically competitive districts to the degree our ensemble did.
Conclusion
Our takeaway from this analysis is that Colorado Congressional district proposed plans that only contain 1 competitive district can be considered an outlier within the universe of potential plans, and based on the 2018 U.S. House election results, Colorado map drawers can aim to design maps that have up to 4 competitive U.S. congressional districts out of a total of 7 districts. However, balancing this condition with other redistricting rules requires trade-offs – that is, it may not be possible to maintain minimal county splits as seen in previous maps while maximizing politically competitive districts. Modeling requires human judgement and in-depth understanding of state-specific priorities, and our Colorado case study outlines a decision-making process that GerryChain users should consider as part of the process. Additionally, we wish to highlight the important nuanced discussion and debate on the value of political competitiveness (see, Deford et al., 2020) as a metric to enshrine into redistricting legal rules. Our analysis here provides one approach on how to apply this analysis in GerryChain, but the trade-offs that come with optimizing political competitive measures come at the expense of other important rules and measures of interest.
As Colorado is due to receive an additional U.S. House seat as part of the 2020 redistricting cycle – bringing their congressional districts from 7 to 8 – map drawers can also use GerryChain to decide where to selectively place new districts. Our Texas case study outlines how to evaluate the placement of new districts, specifically in compliance with the Voting Rights Act of 1965.