Overview
Data
Several Washington State agencies provided data to create the unique Washington Merged Longitudinal Administrative Data (WMLAD); we also used federal data from the US Housing and Urban Development (HUD) to help in our analysis. WMLAD is a novel data resource comprising longitudinal and geocoded administrative records from seven Washington state agencies from 2000 to 2018. We used available demographics as well as home and work geocoded addresses. Previous WMLAD users used Bayesian Improved Surname Geocoding Algorithm to impute missing data on race and addresses. We used HUD’s Office of Policy Development and Research public data on Fair Market Rents (FMR) to access available zipcode level rental price information for the Puget Sound.
To identify trends before and after the Seattle minimum wage, we subsetted WMLAD for 2010 to 2016. Due to limitations of the imputation method, 2017 and 2018 were not used. To prepare the data for analysis, we read background information of the data and reviewed previous minimum wage research. Further, we inspected the raw data then cleaned, wrangled, and merged the data frames/tables of relevant variables. PostgresSQL was used to expedite data queries.
Washington Merged Longitudinal Administrative Data
| State Agency | Key Information | Time Period | Number of Individuals |
|---|---|---|---|
| Employement Security Data | Earnings, hours worked, job characteristics, UI receipt | 2000-2017 | 7,699,646 workers |
| Department of Social and Health Services; Health Care Authority | Program particitpation, benefits received, race/ethnicty, sex, age, residential address | 2010-2017 | 4,968,258 clients |
| Department of Health | Race/ethnicity, sex, age, residential address | 2010-2016 | 896,558 parents |
| Secretary of State | Voting history, sex, age, residential address | 2006-2016 | 6,084,439 voters |
| Department of Licensing | Age, sex, residential address | 2005-2016 | 8,367,317 licenses |
| WA State Patrol | Arrest information | 2000-2018 | 777,416 persons arrested |
Tools
Software packages, modules, etc.
Rstudio was our main analysis tool.
- We utilized several tidyverse packages, such as haven, dplyr, tidyr, and ggplot2.
- Graphhopper is a Java tool with an R wrapper we used to analyze commute burden
- Remote Git Server was used throughout our collaborative workflow
- PostgreSQL was used to expedite merging and wrangling large datasets
Dependencies between software, packages and modules that were interoperable
The many R packages used here were inherently interoperable. PostgreSQL has an R Wrapper to read and write tables into the data frame for SQL queries. Because of the sensitivity of the data, outside packages/software were either approved or denied upon request from the enclave administrator.
Enclave Workflow
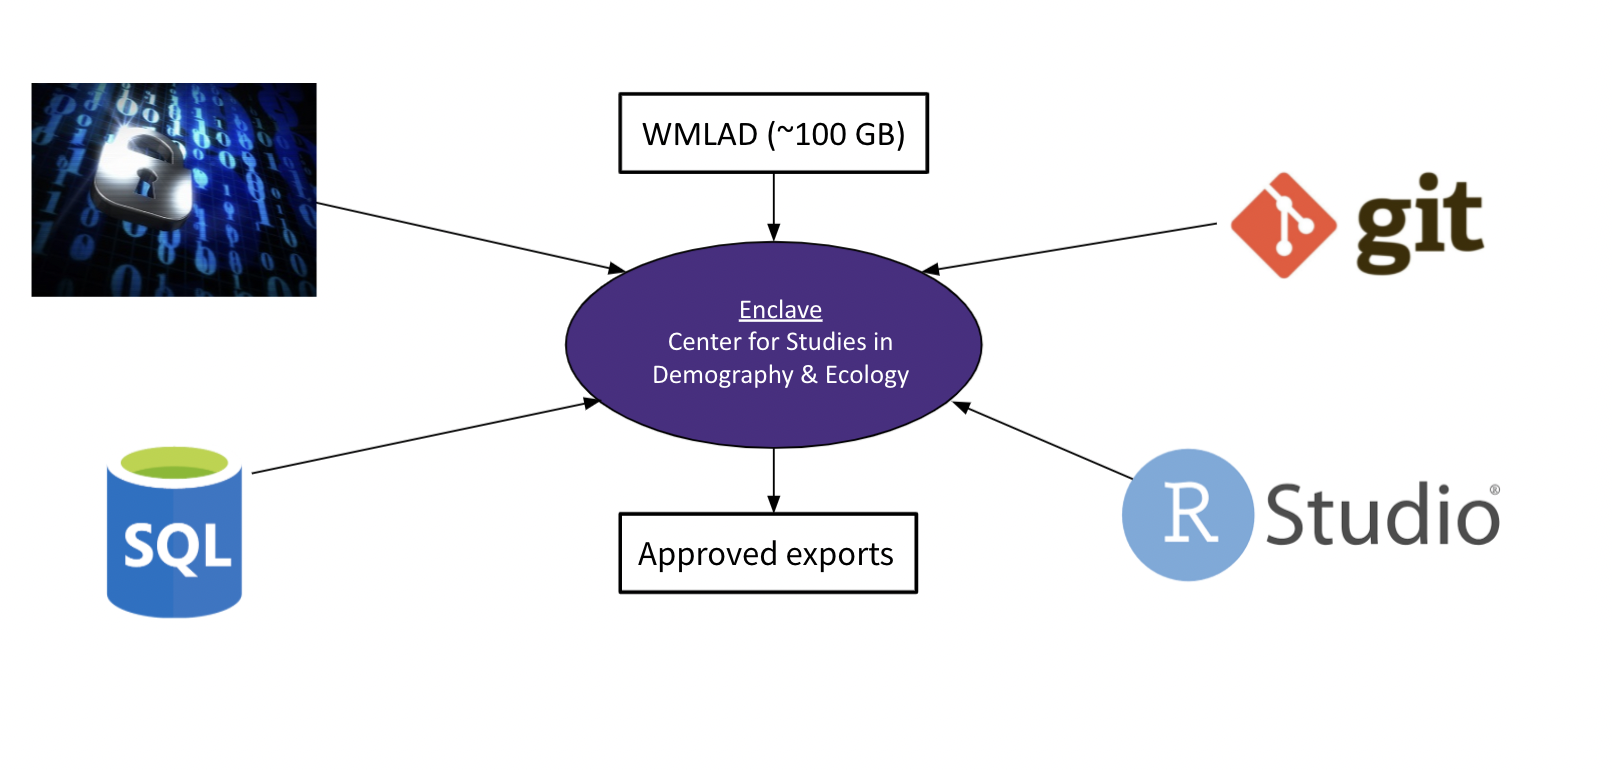
Considering that our team was dealing with highly senstive information from various state agencies, we needed to ensure that our data handling practices respected the privacy of the individuals represented. An important step towards this was finding a location that would allow us to securely access the data. For this, a remote server (or enclave), hosted by the Center for Studies in Demography & Ecology at the University of Washington, is used to store the data with an added measure that it is disconnected from the internet. This ensures that no files or information within the enclave will be transferred via the internet. While this is a necessary precaution, it highly impacts a typical workflow in data science type projects. For instance, handling the several hundred gigabytes of WMLAD is limited by the processing power held by the enclave, where super computers or cloud services may be preferable. This challenged our team to find solutions for expediting data reads, writing efficient code, using git servers for collaboration, and recommending a workflow for future WMLAD users. The combination of working with WMLAD within the enclave puts forth this idea that we are not only working with Big Data, but we are working with Big Sensitive Administrative Data.
Analyses
Given the extensive nature of WMLAD, we used descriptive analyses to explore low-wage workers mobility over time. Descriptive analyses allow us to describe and summarize the distribution, housing burden, displacement, and commute burden of low-wage workers. This can inform the types of inferential questions researchers ask, serving as the foundation for further statistical data analysis.
Limitations
We can make limited claims, particularly inferential claims, because we examined descriptive statistics. As a result, the claims we make are qualified with several assumptions. The sensitive nature of the data also limits our ability to provide a completely transparent description of all processes; other than to future WMLAD users
Potential Improvements
- Writing cleaner, more efficient code
- A set of clear and vetted procedures for version control within the enclave. The version control workflow has been an iterative process
- Exploration with the data is a massive undertaking and would likely require more time to understand the data better.
- More domain experts with the administrative data would have been beneficial
- Future fellows/researchers can strive to provide visuals/deliverables specifically for organizations doing work around the minimum wage, gentrification, and/or displacement