Scaling Workflows#
We demonstrate how GitHub Actions can be used for scaling computationally expensive workflows through a use case aiming to measure glacier surface velocity from satellite imagery.
how to perform batch computing by running many workflows in parallel
how to build complex pipelines by calling workflows from another workflow
how to specify paramers to run a workflow
Measuring Glacier Surface Velocity#
Quinn Brencher, University of Washington
This set of Github Actions workflows allows you to measure horizontal glacier surface velocity from Sentinel-2 image pairs using autoRIFT software. No external accounts or API keys are required. These workflows were created for the Github Actions for Scientific Data Workflows workshop at the 2024 SciPy conference.
Usage#
We use three workflows to batch process image pairs for glacier surface velocity. For demonstration purposes the workflows are only set up to work over the Yazghil Glacier in Pakistan. To run the workflows, simply fork this repository, visit the “Actions” tab, and choose the batch_image_correlation workflow (which runs the other two workflows as well).
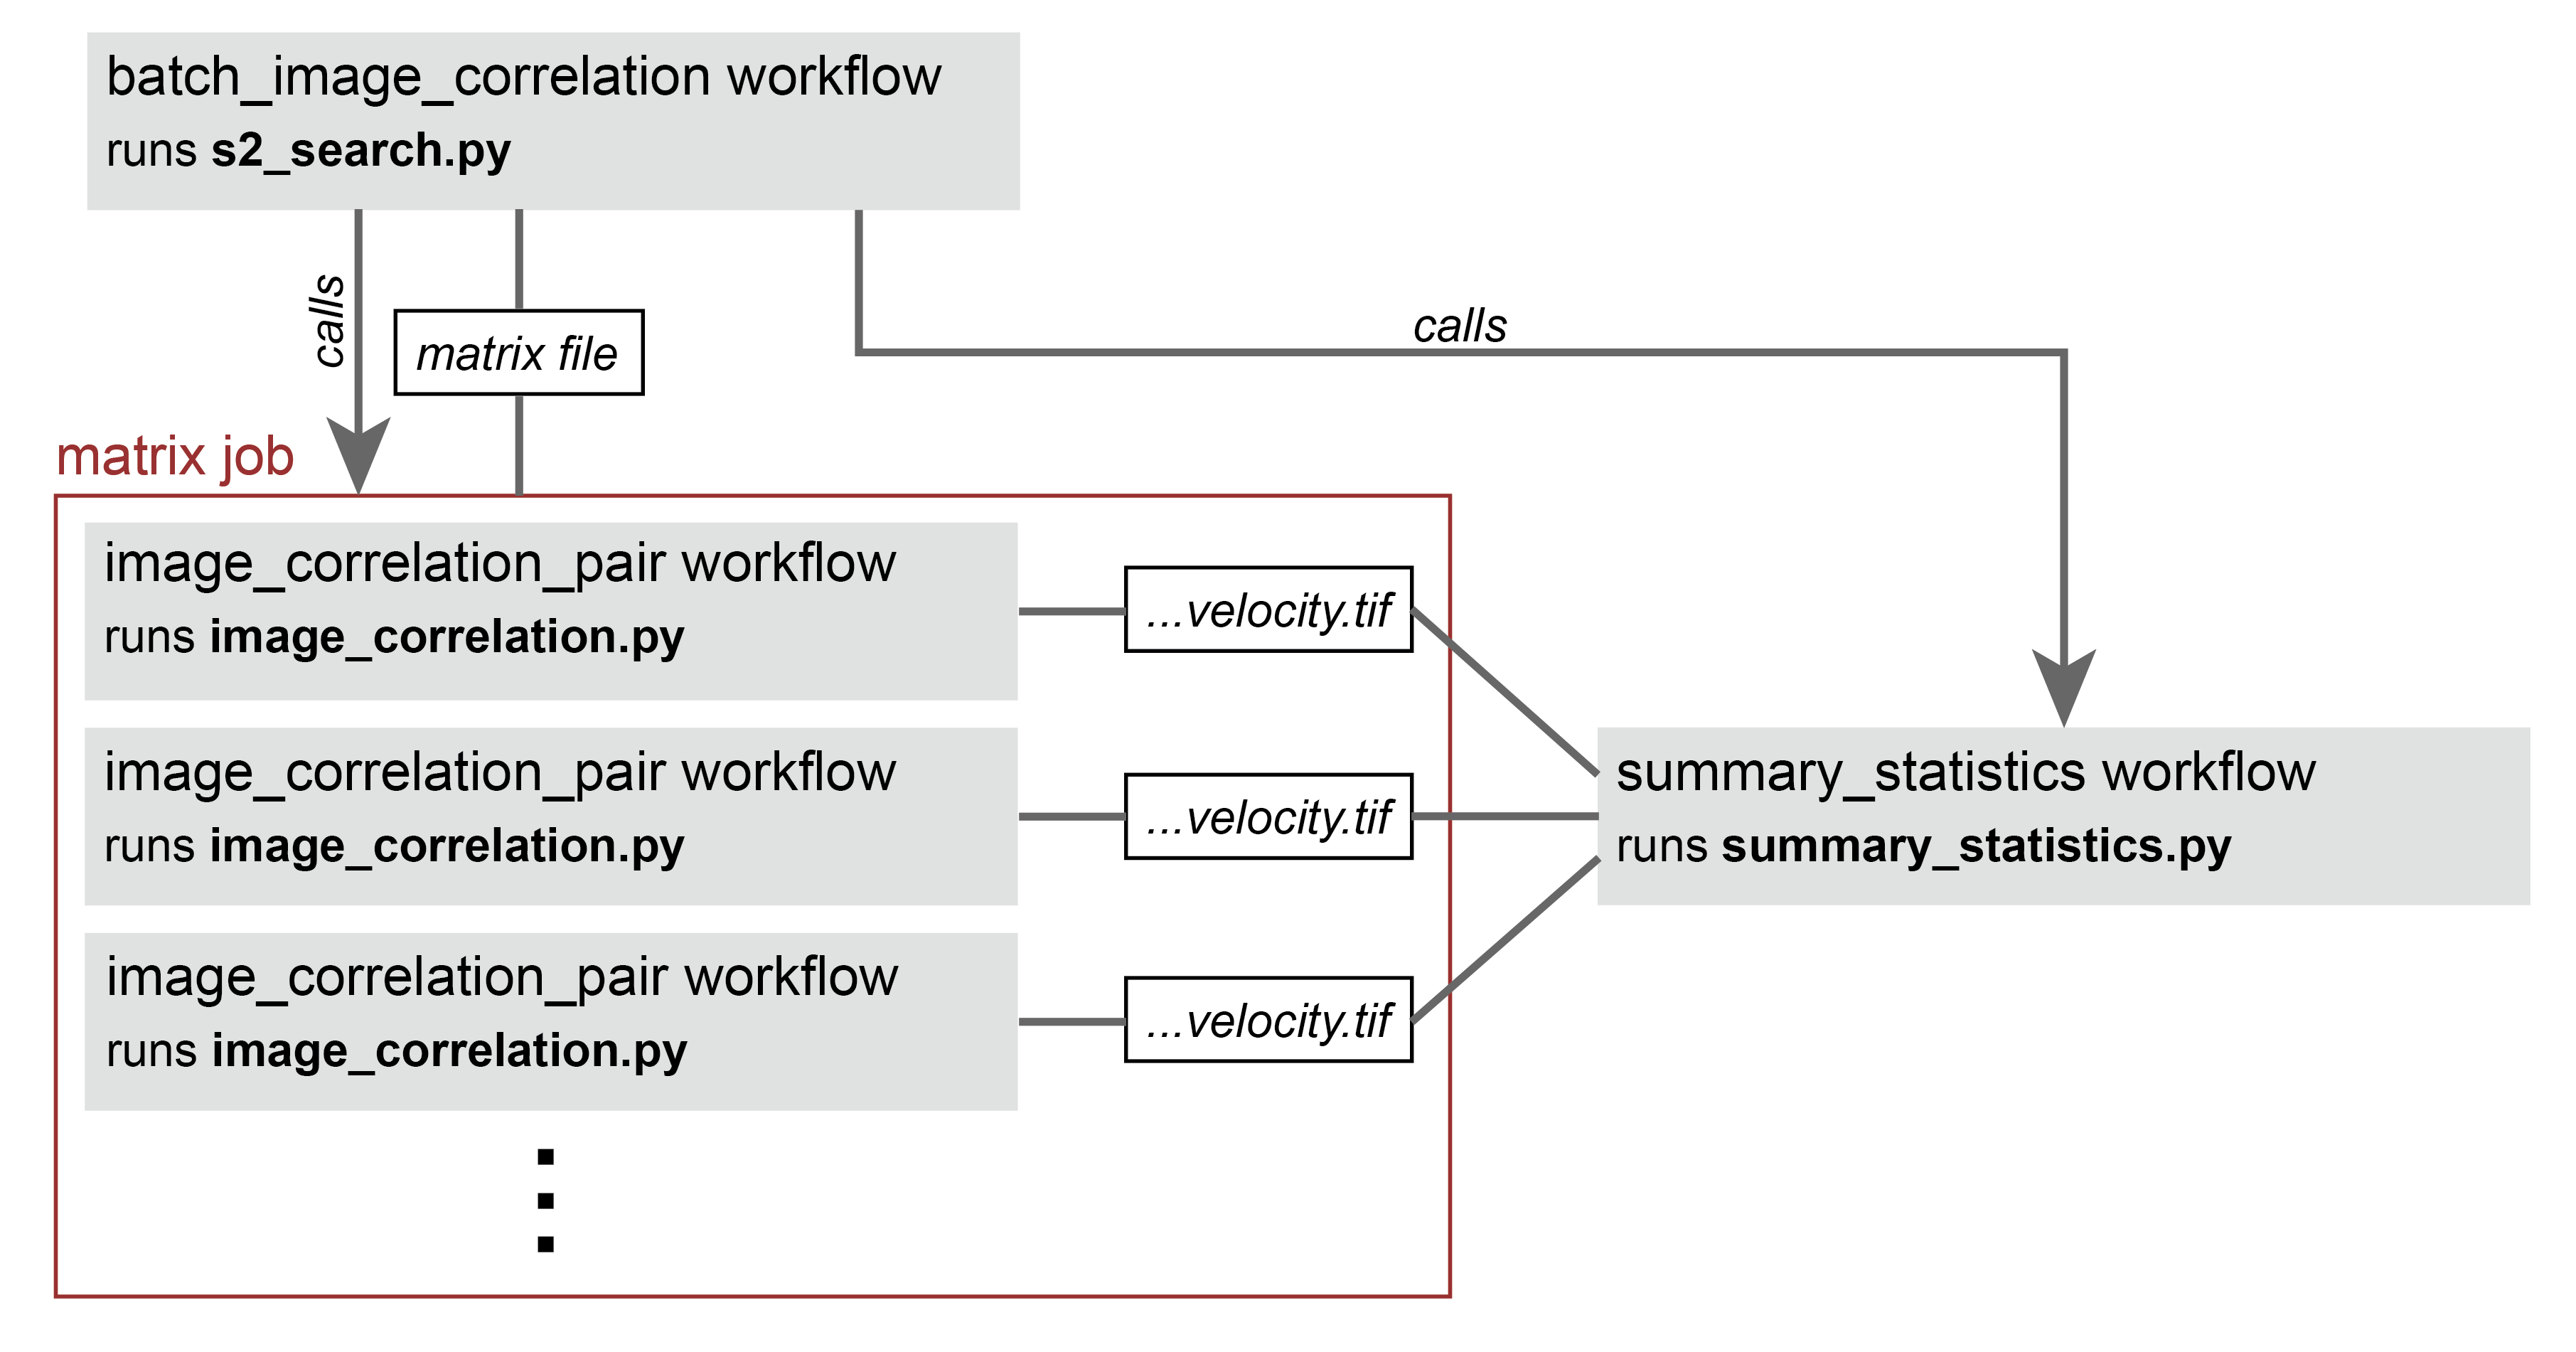
1. image_correlation_pair#
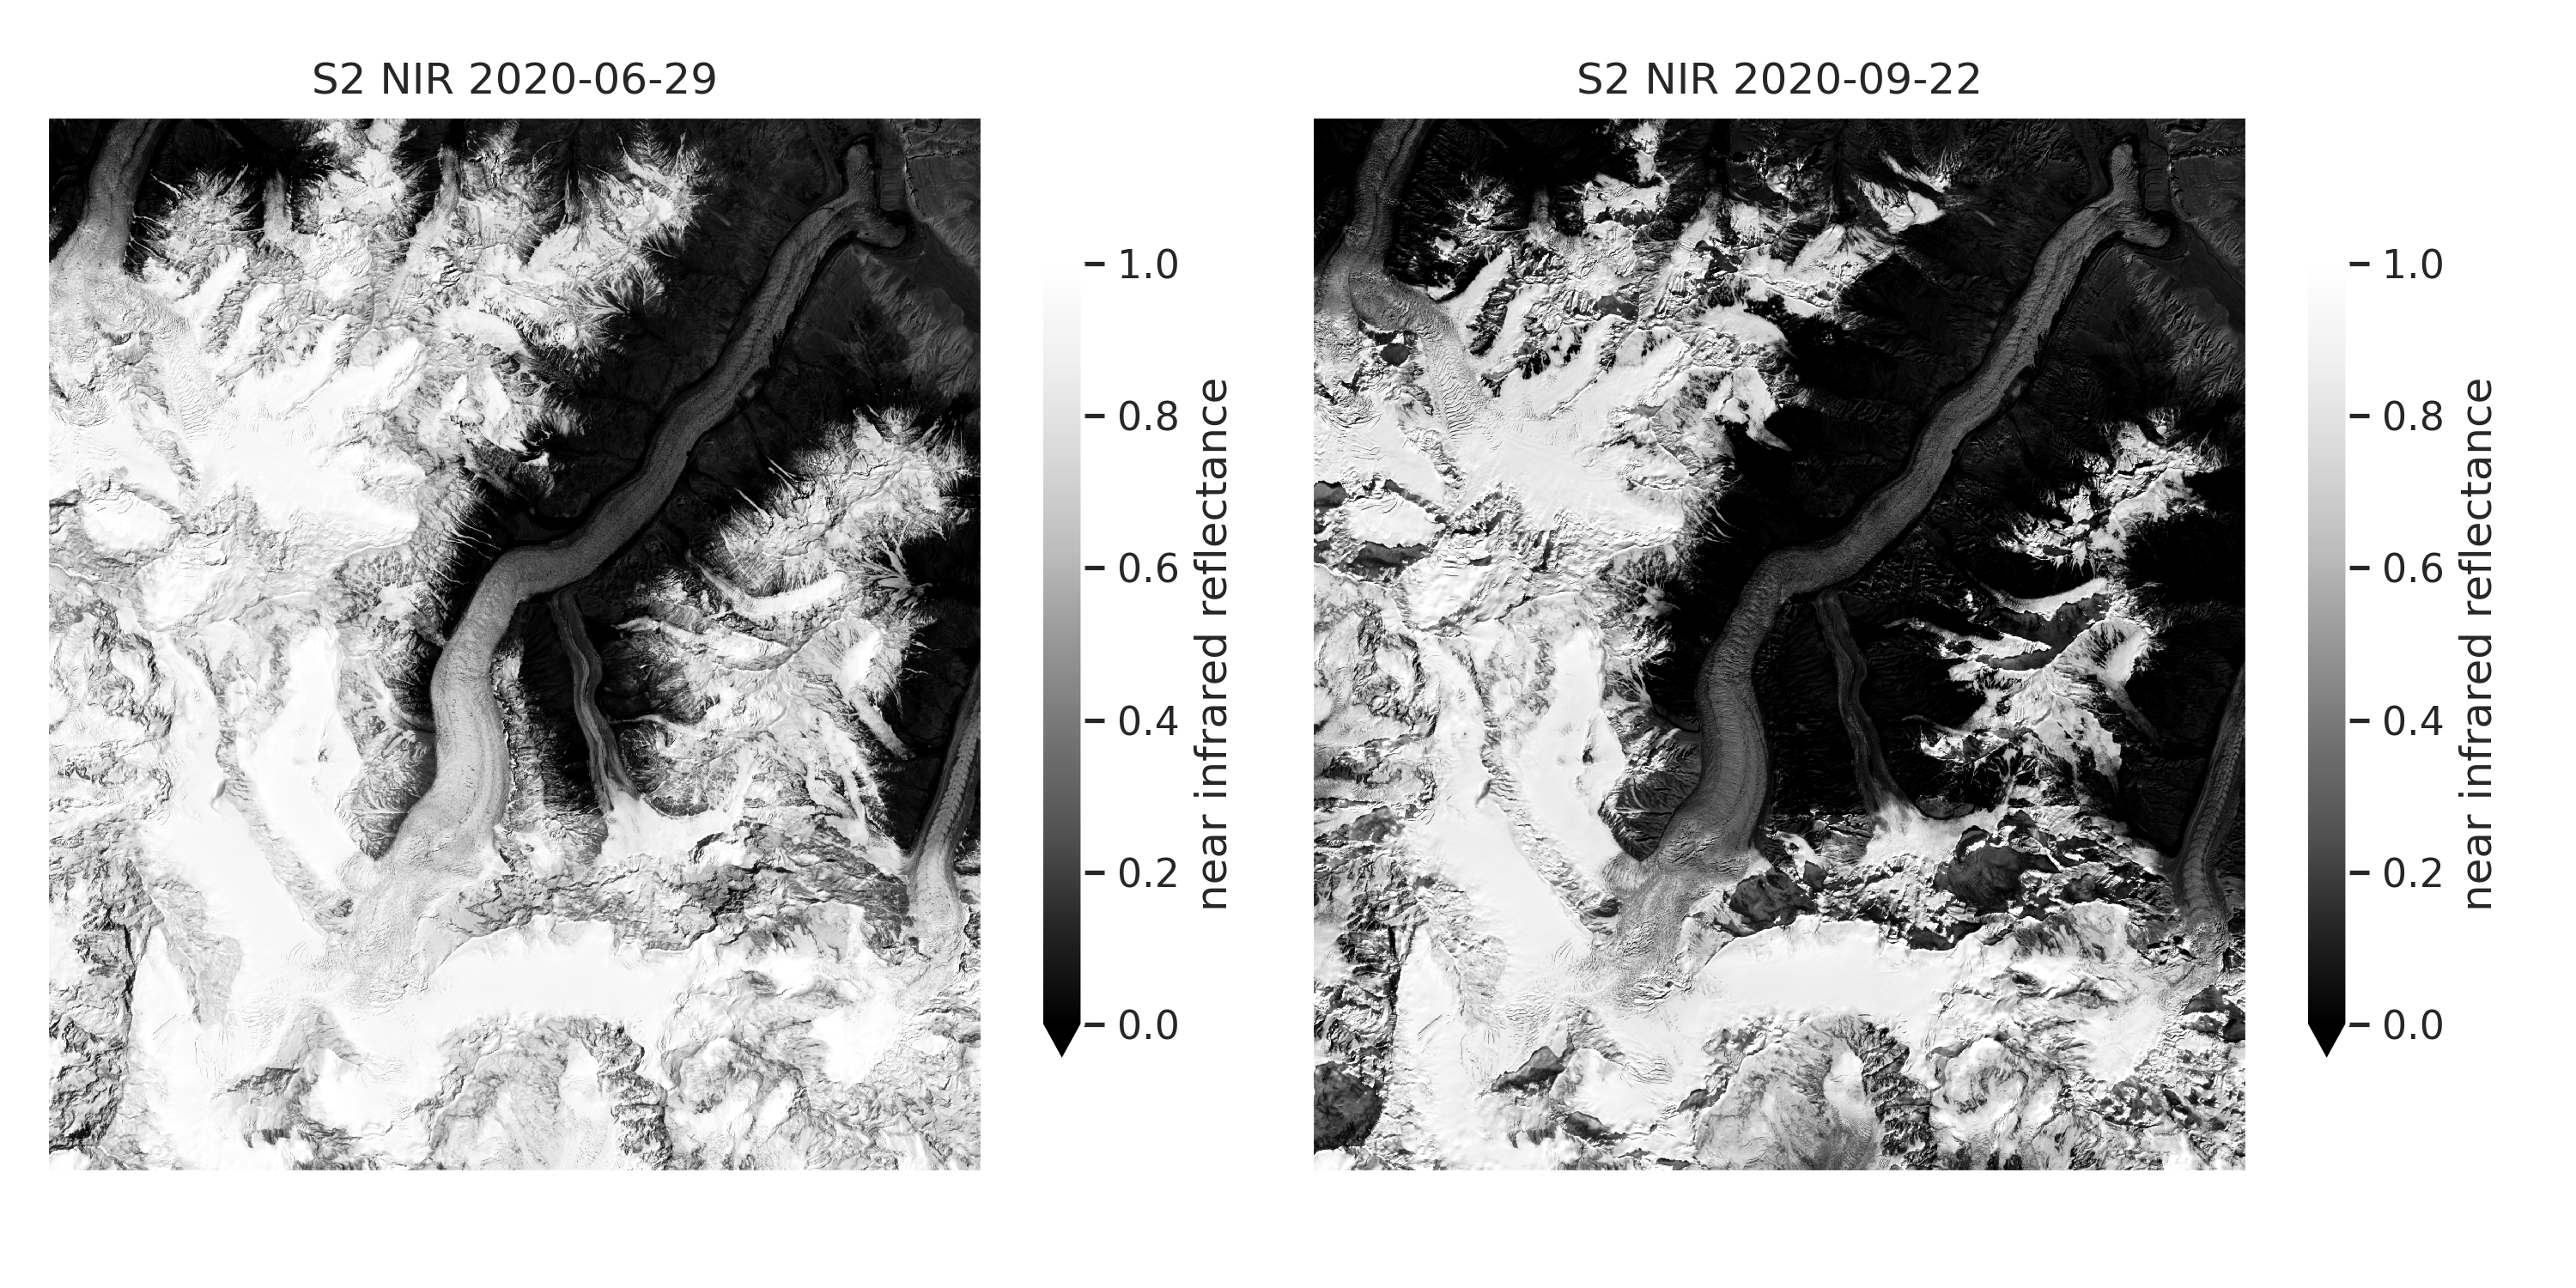
This workflow calls a Python script (image_correlation.py) that runs autoRIFT on a pair of spatially overlapping Sentinel-2 L2A images. It requires the product names of the two images. The images are downloaded from aws using the Element 84 Earth Search API. Only the near infrared band (NIR, B08) is used which has a spatial resolution of 10 m. autoRIFT is used to perform image correlation. Search distances are scaled with temporal baseline assuming a maximum surface velocity of 1000 m/yr, so images acquired farther apart in time take longer to process. Surface velocity maps are saved as geotifs and uploaded as Github Artifacts.
2. batch_image_correlation#
This workflow can be used to create surface velocity maps from many pairs of Sentinel-2 images. Required inputs include maximum cloud cover percent, start month (recommend >=5 to minimize snow cover), end month (recommend <=10 to minimize snow cover), and number of pairs per image, e.g.:
1 pair per image: (imgi, imgi+1), (imgi+1, imgi+2), (imgi+2, imgi+3), …
2 pairs per image: (imgi, imgi+1), (imgi, imgi+2), (imgi+1, imgi+2), …
3 pairs per image: (imgi, imgi+1), (imgi, imgi+2), (imgi, imgi+3), …
Only the first suitable image is selected for each month. Once image pairs are identified, a matrix job is set up to run image_correlation_pair for each pair. Finally, summary_statistics is run.
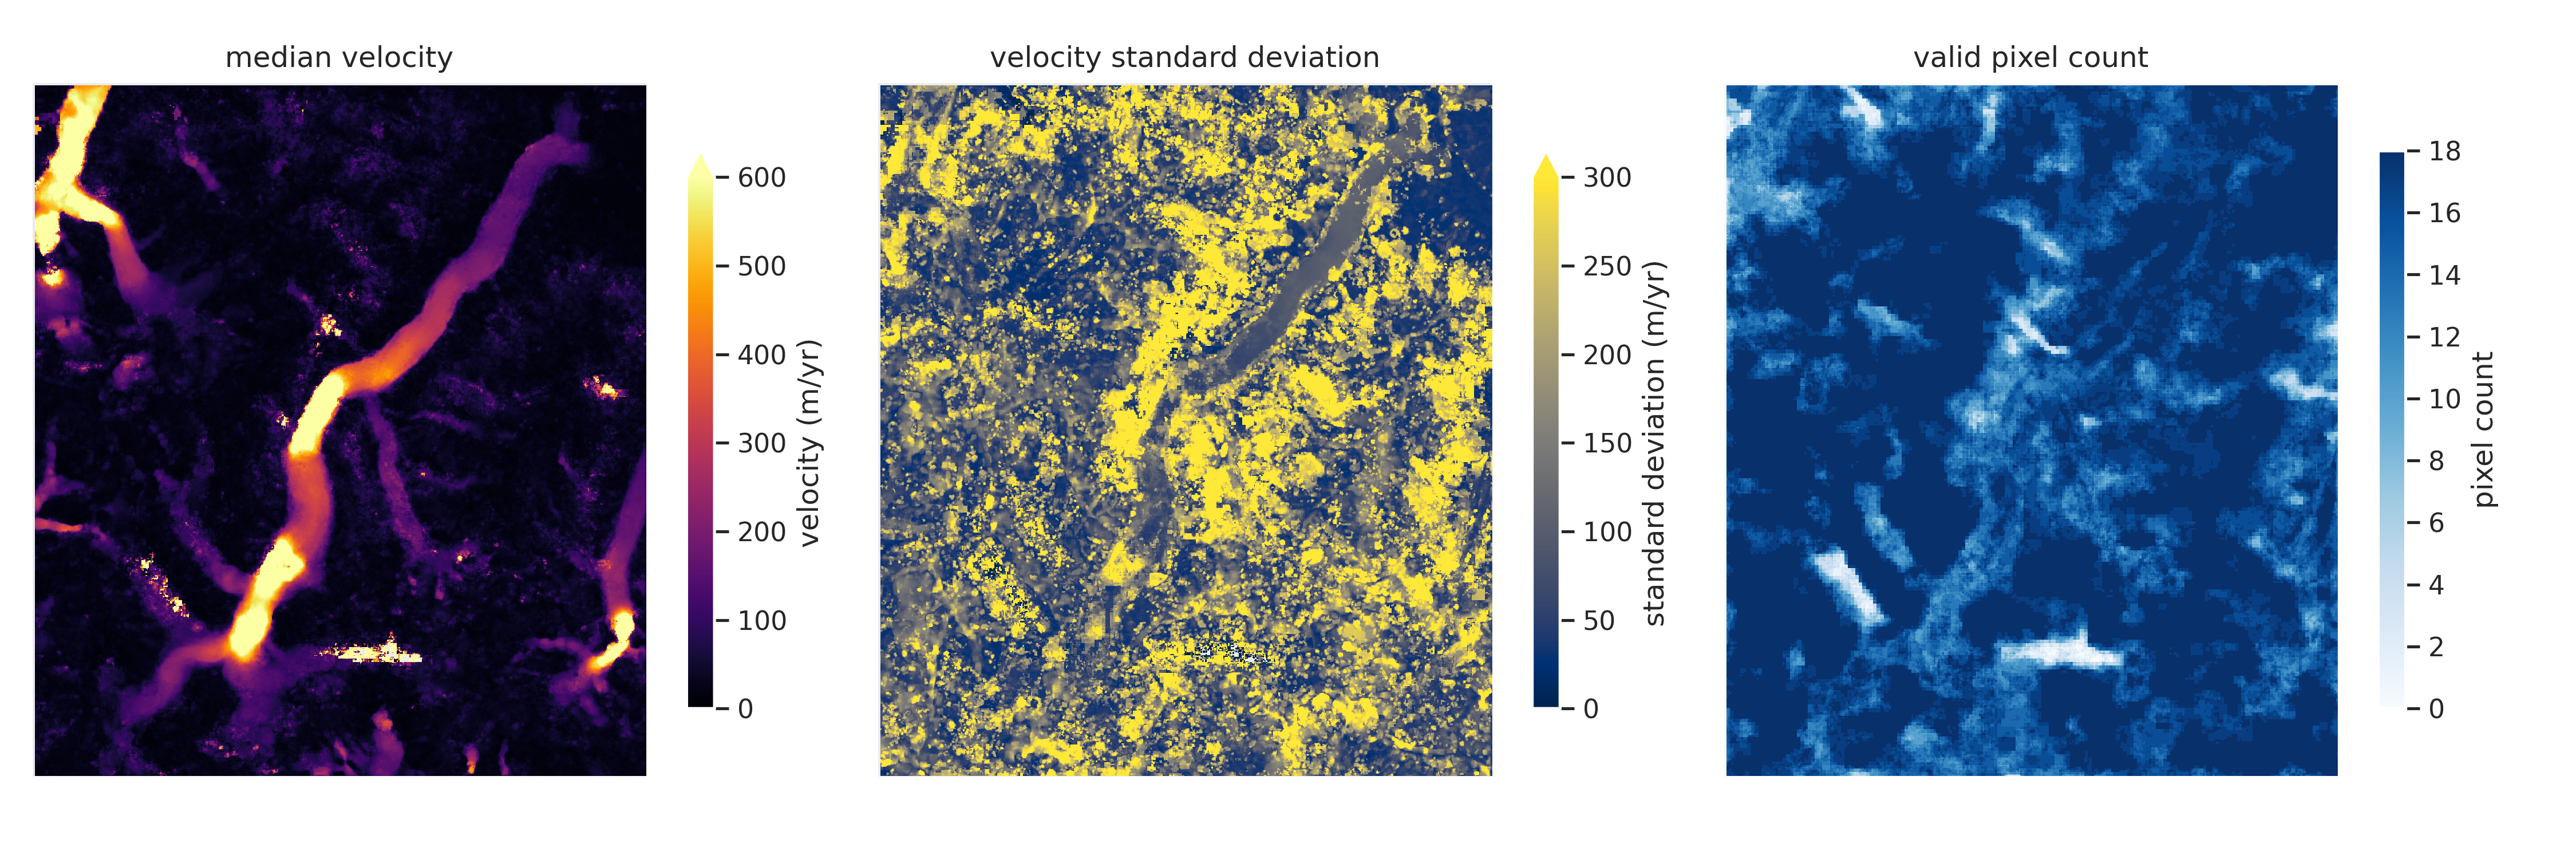
3. summary_statistics#
This workflow downloads all of the velocity maps created during a batch_image_correlation run and uses them to calculate and plot median velocity, standard deviation of velocity, and valid pixel count across all velocity maps. The summary statistics plot is uploaded as a Github Artifact.
Acknowledgements#
Scott Henderson developed many of the original ideas and much of code used for this set of workflows