Scheduled Algorithm Deployment Workflow#
Use Case: Orcasound Stream Spectrogram Visualization#
Next, we will demonstrate how GitHub Actions can be used to display a spectrogram for a segment from an underwater audio stream.
Spectrogram Visualization Workflow: .github/workflows/noise_processing.yml
Workflow Steps:
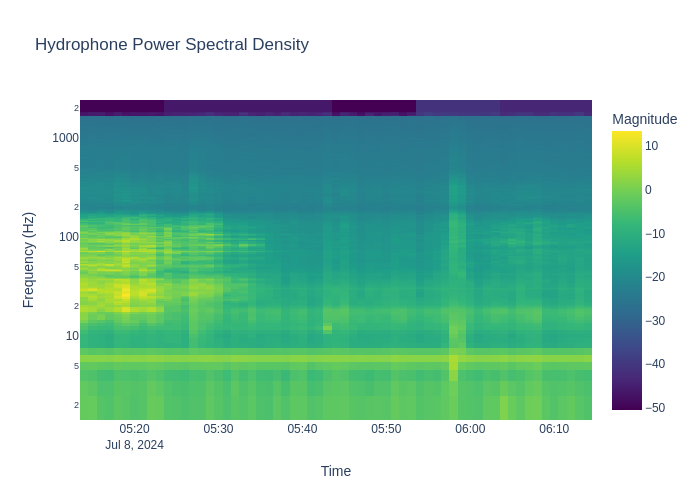
Generate spectrogram for a period of time (with
ambient_sound_analysispackage)Download data from AWS S3 bucket (in
.tsformat) for a given time periodConvert many small
.tsfiles to one file in.wavformatGenerate power spectrogram and store it in
.parquetformat
Read the power spectrogram in
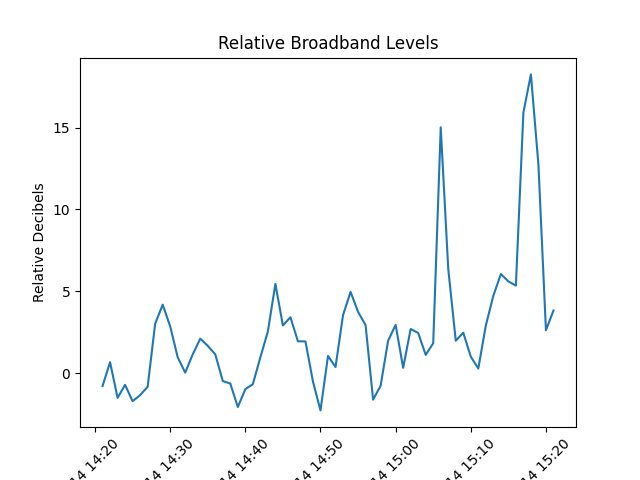
pandasdataframe formatCreate plots and save them:
psd.pngandbroadband.png.Upload the
.pngfiles to GitHub
After the workflow is executed psd.png and broadband.pngfiles are updated in the repo and are visualized below.