Results
Who uses the HOT lanes?
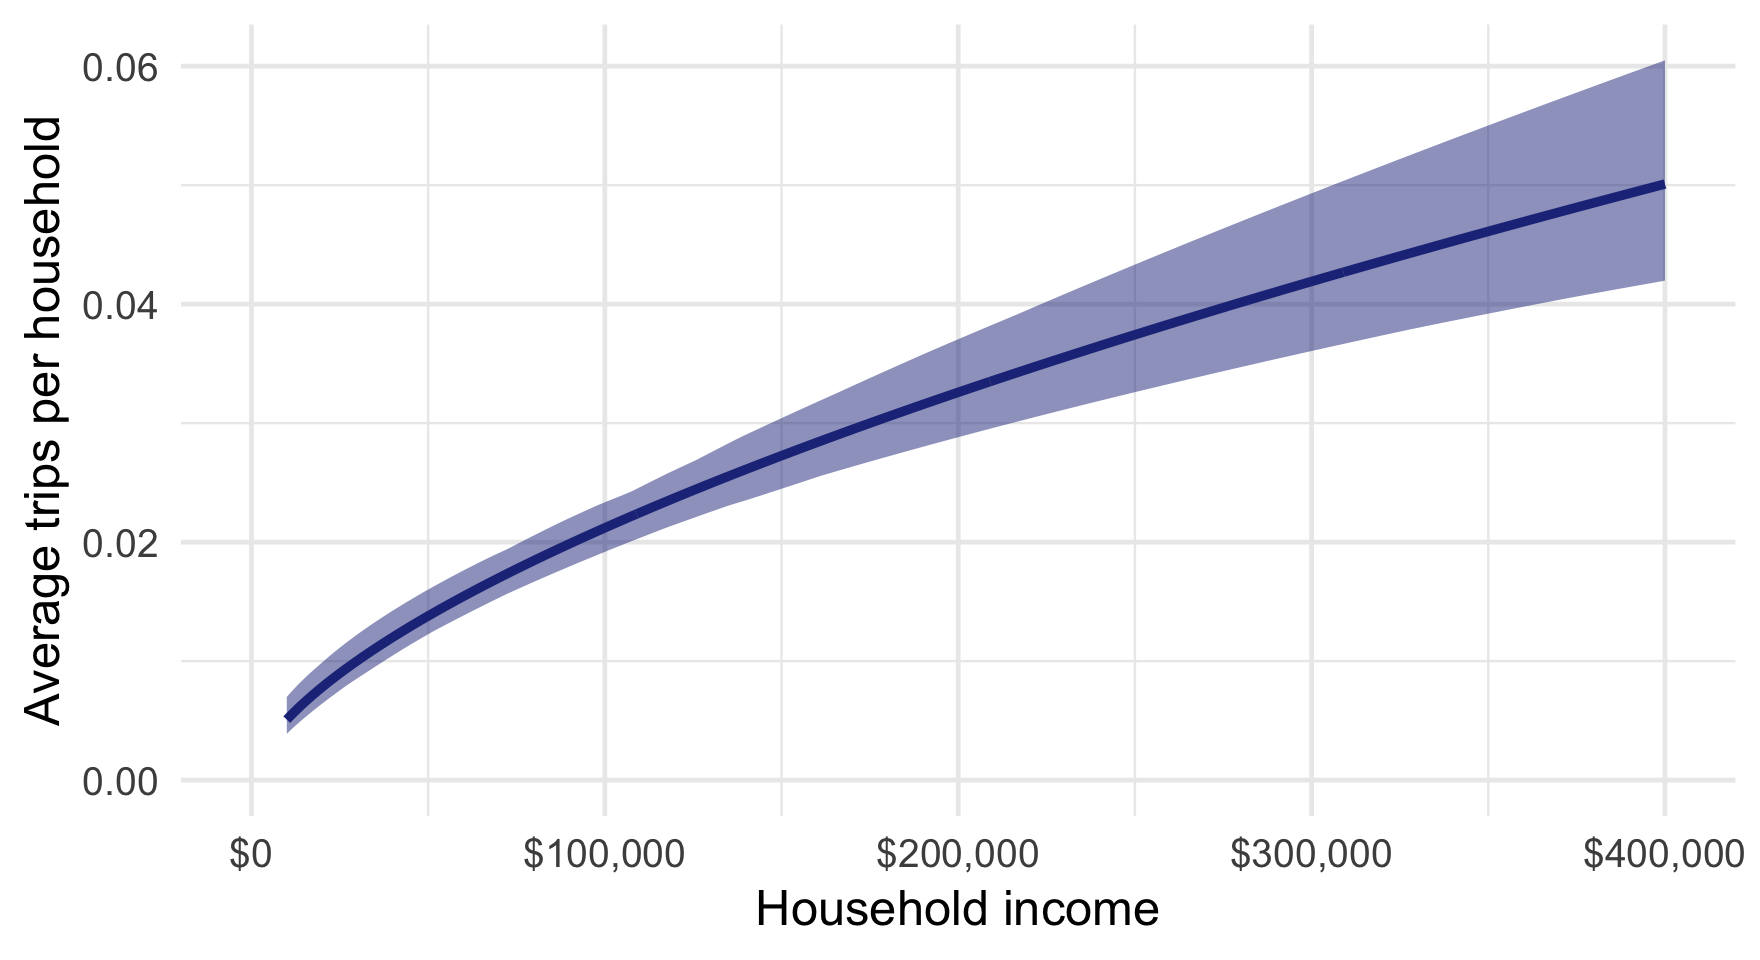
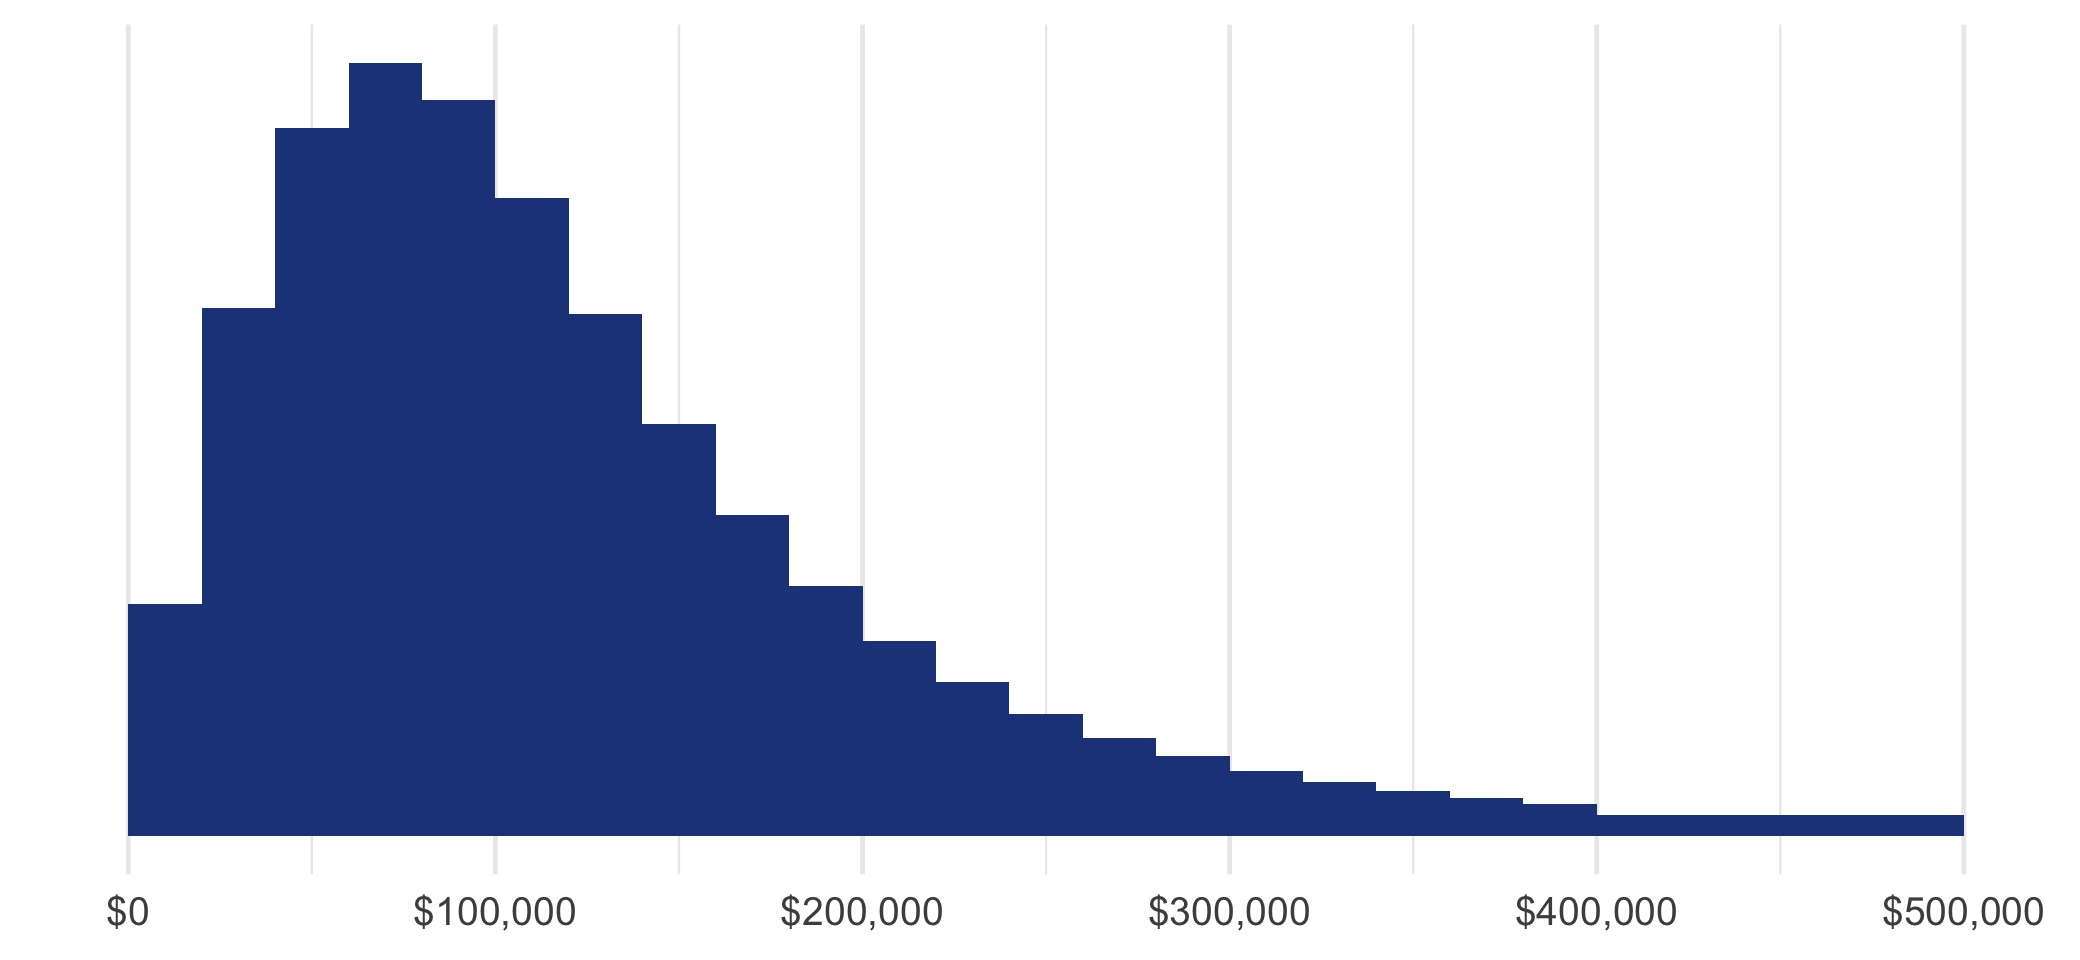
We estimate that the median household income of noncommercial HOT lane users is approximately $101,000 per year, around 20% higher than the median household income of King and Snohomish counties. As the above figure shows, 15 trips are made for every 1,000 households in the region making $50,000 per year, while 35 trips are made for every 1,000 households making $200,000 per year, a 133% increase. Yet most facility trips are not made by high-income households, as the figure below shows. We estimate that over 80% of facility users have an income below $200,000 per year.
Who benefits from the HOT lanes?
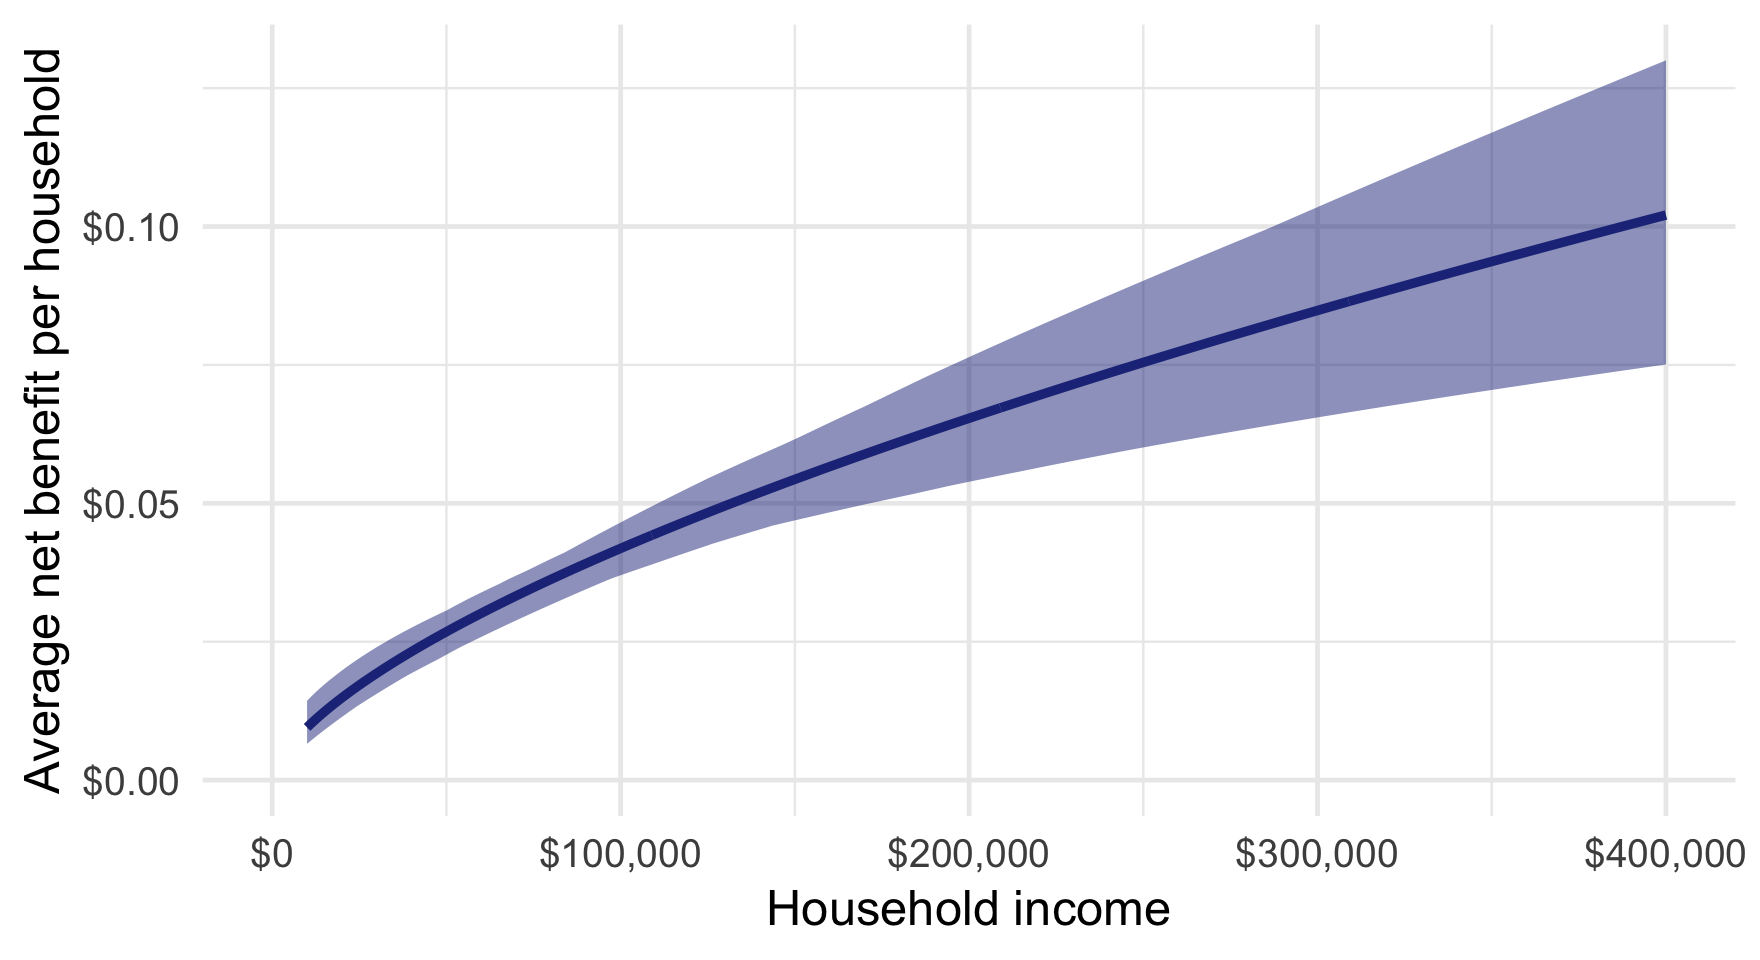
Higher-income households accrue far more net benefit than lower-income households do, as the above figure demonstrates. The average $200,000-per-year household in the region gains around 6.5 cents in net benefit from the facility, 86% higher than the 3.5 cents gained by the average household making $50,000 per year. This pattern is almost to be expected, however, given the income differential in usage. Households which use the facility more often naturally accrue more benefits. In fact, the same $200,000-per-year household which takes in 86% more benefits than a $50,000-per-year household uses the facility 133% more. This discrepancy becomes much more visible when net benefits are considered on a per-trip basis.
Who benefits per trip?
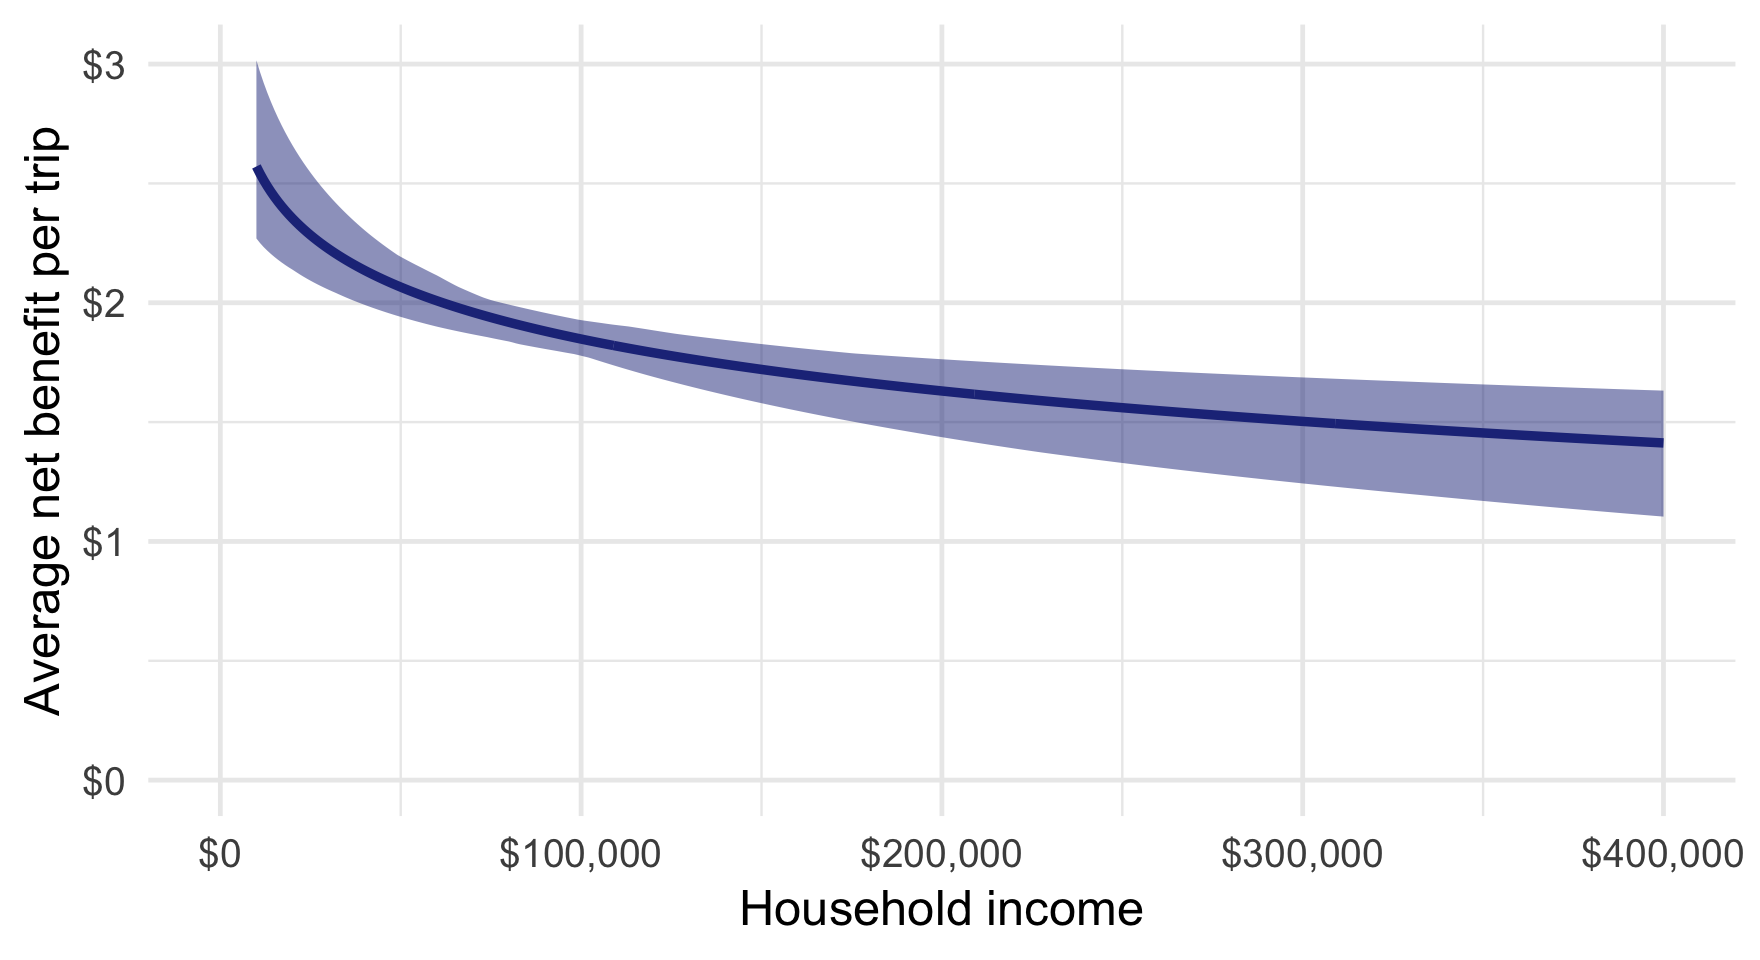
The equity picture looks much different per trip. Lower-income households actually gain more net benefit per trip than do higher-income households. Returning to the same hypothetical households above, at $200,000 and $50,000, the former gains 21% less in net benefit per trip than the latter does. Overall, however, the distribution is quite even: nearly all drivers can expect a per-trip net benefit between $1.50 and $2.50. Of course, there is substantial variation in net benefit across specific trips; the findings presented here are merely averages across a large number of users and trips.
Presentation slides