Results
Main Table
The main table holds the columns that are consistent across all files of the Self-Sufficiency Standard that were available (as of August 2022). Each file contains family type, state, place, year, analysis type, which are our primary keys. A primary key a unique identifier that ties each table record. Within the files, there is a breakdown of family type including the number of adults, infants, preschoolers, schoolagers, and teenagers. There is also a weighted child count where, after 6 children, there is no specific count of children in each age group, instead just total number of children is reported.
For each family type, the main table includes:
- The monthly costs of many life essentials (housing, child care, transportation, health care, miscellaneous, and taxes)
- Hourly, monthly, and annual wages to reach self-sufficiency
- An emergency savings column which includes the amount needed to be saved per month for emergencies based on the combination of costs
We created columns that state whether there is extra information for that row in one of the helper tables. We included miscellaneous_is_secondary, health_care_is_secondary, and analysis_is_secondary Boolean columns. These columns contain True and False values that represent whether there is data in the helper tables related to the breakdown of miscellaneous costs (broadband and cell phone expenses), health care (premium and out-of-pocket expenses), and other analyses (i.e., ARPA analysis for the state of Oregon).
Helper Tables
ARPA
ARPA stands for the American Rescue Plan Analysis, this analysis was done exclusively for the state of Oregon in 2021. For this helper table, if a file contained columns that were found exclusively in the ARPA file, weinserted data from that file into this table. Currently, there is only one file with data in this secondary table.
Health Care
This helper table contains the breakdown of health care, specifically, into premium, which is the costs of health care employers cover, and out-of-pocket expenses for that family type.
Miscellaneous
This helper table contains the breakdown of the miscellaneous costs in our primary table into broadband and cell phone and then other necessities.
Documentation
To ensure the database workflow is accessible, reproducible, and transparent for our stakeholders, we created two sets of documentation. One instructs the user on how to set up their technical environment and enter data from files. The other demonstrates how to retrieve and make visualizations from the data. The first set of instructions is in markdown files in the repository (split between a computer setup file and the README file). We developed these instructions through multiple iterations of editing and feedback from our project leads. Our goal was to tailor the language for users who are less tech-savvy by using user-friendly terms and reducing technical jargon.
Figure 2: Documentation on Github repository
Analysis
Gender Wage Gap
The earnings gap between men and women varies by state. We conducted an analysis for three household types:
- 1 adult
- 1 adult and 1 preschooler
- 1 adult, 1 preschooler, and 1 school-age
As engineers, we were interested in analyzing the cities that are hubs for technology. Thus, we choose King County (Seattle) and San Francisco County, which encompasses the entire city of San Francisco. We found that both female and male adults can afford to live alone in both cities. However, when a child is involved, single mothers cannot afford to make ends meet with 1 preschooler in both cities. Single fathers with 1 preschooler plus 1 school age child make a liveable wage in both cities. This clearly shows that there is a greater impact of the gender wage gap on the cost of living.
Figure 3: Impact of gender wage gap on the cost of living
Comparing Grad Student Salaries to the SSS
With the creation of the database, researchers can now compare the annual wages for Self-Sufficiency across different places and years. For this analysis, we compared salaries to the SSS annual wage for a single adult across two locations and years. Specifically, we are looking at the wages for single Ph.D. students.
We examined Ph.D. wages for students at the University of Washington (UW) to the Self-Sufficiency annual wages for King County - Seattle. In addition, we compared the wages for Ph.D. students at the University of California, Los Angeles (UCLA) to the Self-Sufficiency annual wages for Los Angeles County.
We found that in 2020, single UW Ph.D. students were slightly above the Self-Sufficiency annual wages in Seattle. However, in 2021, this was no longer the case. Furthermore, single UCLA Ph.D. students were below the Self-Sufficiency Standard for 2020 and 2021.
Figure 4: Self-Sufficiency wages in King County (Seattle) and Los Angeles County
National Comparisons
There is a big gap between the Self-Sufficiency Standard and the poverty threshold. We created a live, interactive website where you can click an area to compare these two standards. For the first time ever, we can now compare the Self-Sufficiency Standard and the poverty line nationally. The deeper purple area represents the higher percent of people below the SSS across all family types. When we click on the state polygon, the percentage of population under the Self-Sufficiency Standard and the percentage of population under poverty line will show on the top left. Similarly, when we zoom into the PUMA area, the percentage of the Self-Sufficiency Standard and poverty threshold of this PUMA area will pop-up on the right. The database and this map make the gap between the Standard and poverty threshold more explicit about across different geographic regions. You can interact with a desktop version of the map here.
Figure 5: Map of Self-Sufficiency Standard and Poverty Threshold national comparison
Database Dashboard Interface
As this is an ongoing contribution to a long-term project, we wanted to envision how the database will live on in a visual and accessible format. Below is a dashboard design concept tailored for a general audience to explore the Self-Sufficiency Standard in a more digestible format. You can clearly see the database structure and the table you are accessing in the first column. You can explore the standard for specific states, counties, years, and family types in the middle column. After the database returns the monthly costs, you easily drag the values you want to visualize in a plot in the third column. While this is just a concept design, it can be handed off to the CWW to build as the database gets further developed.
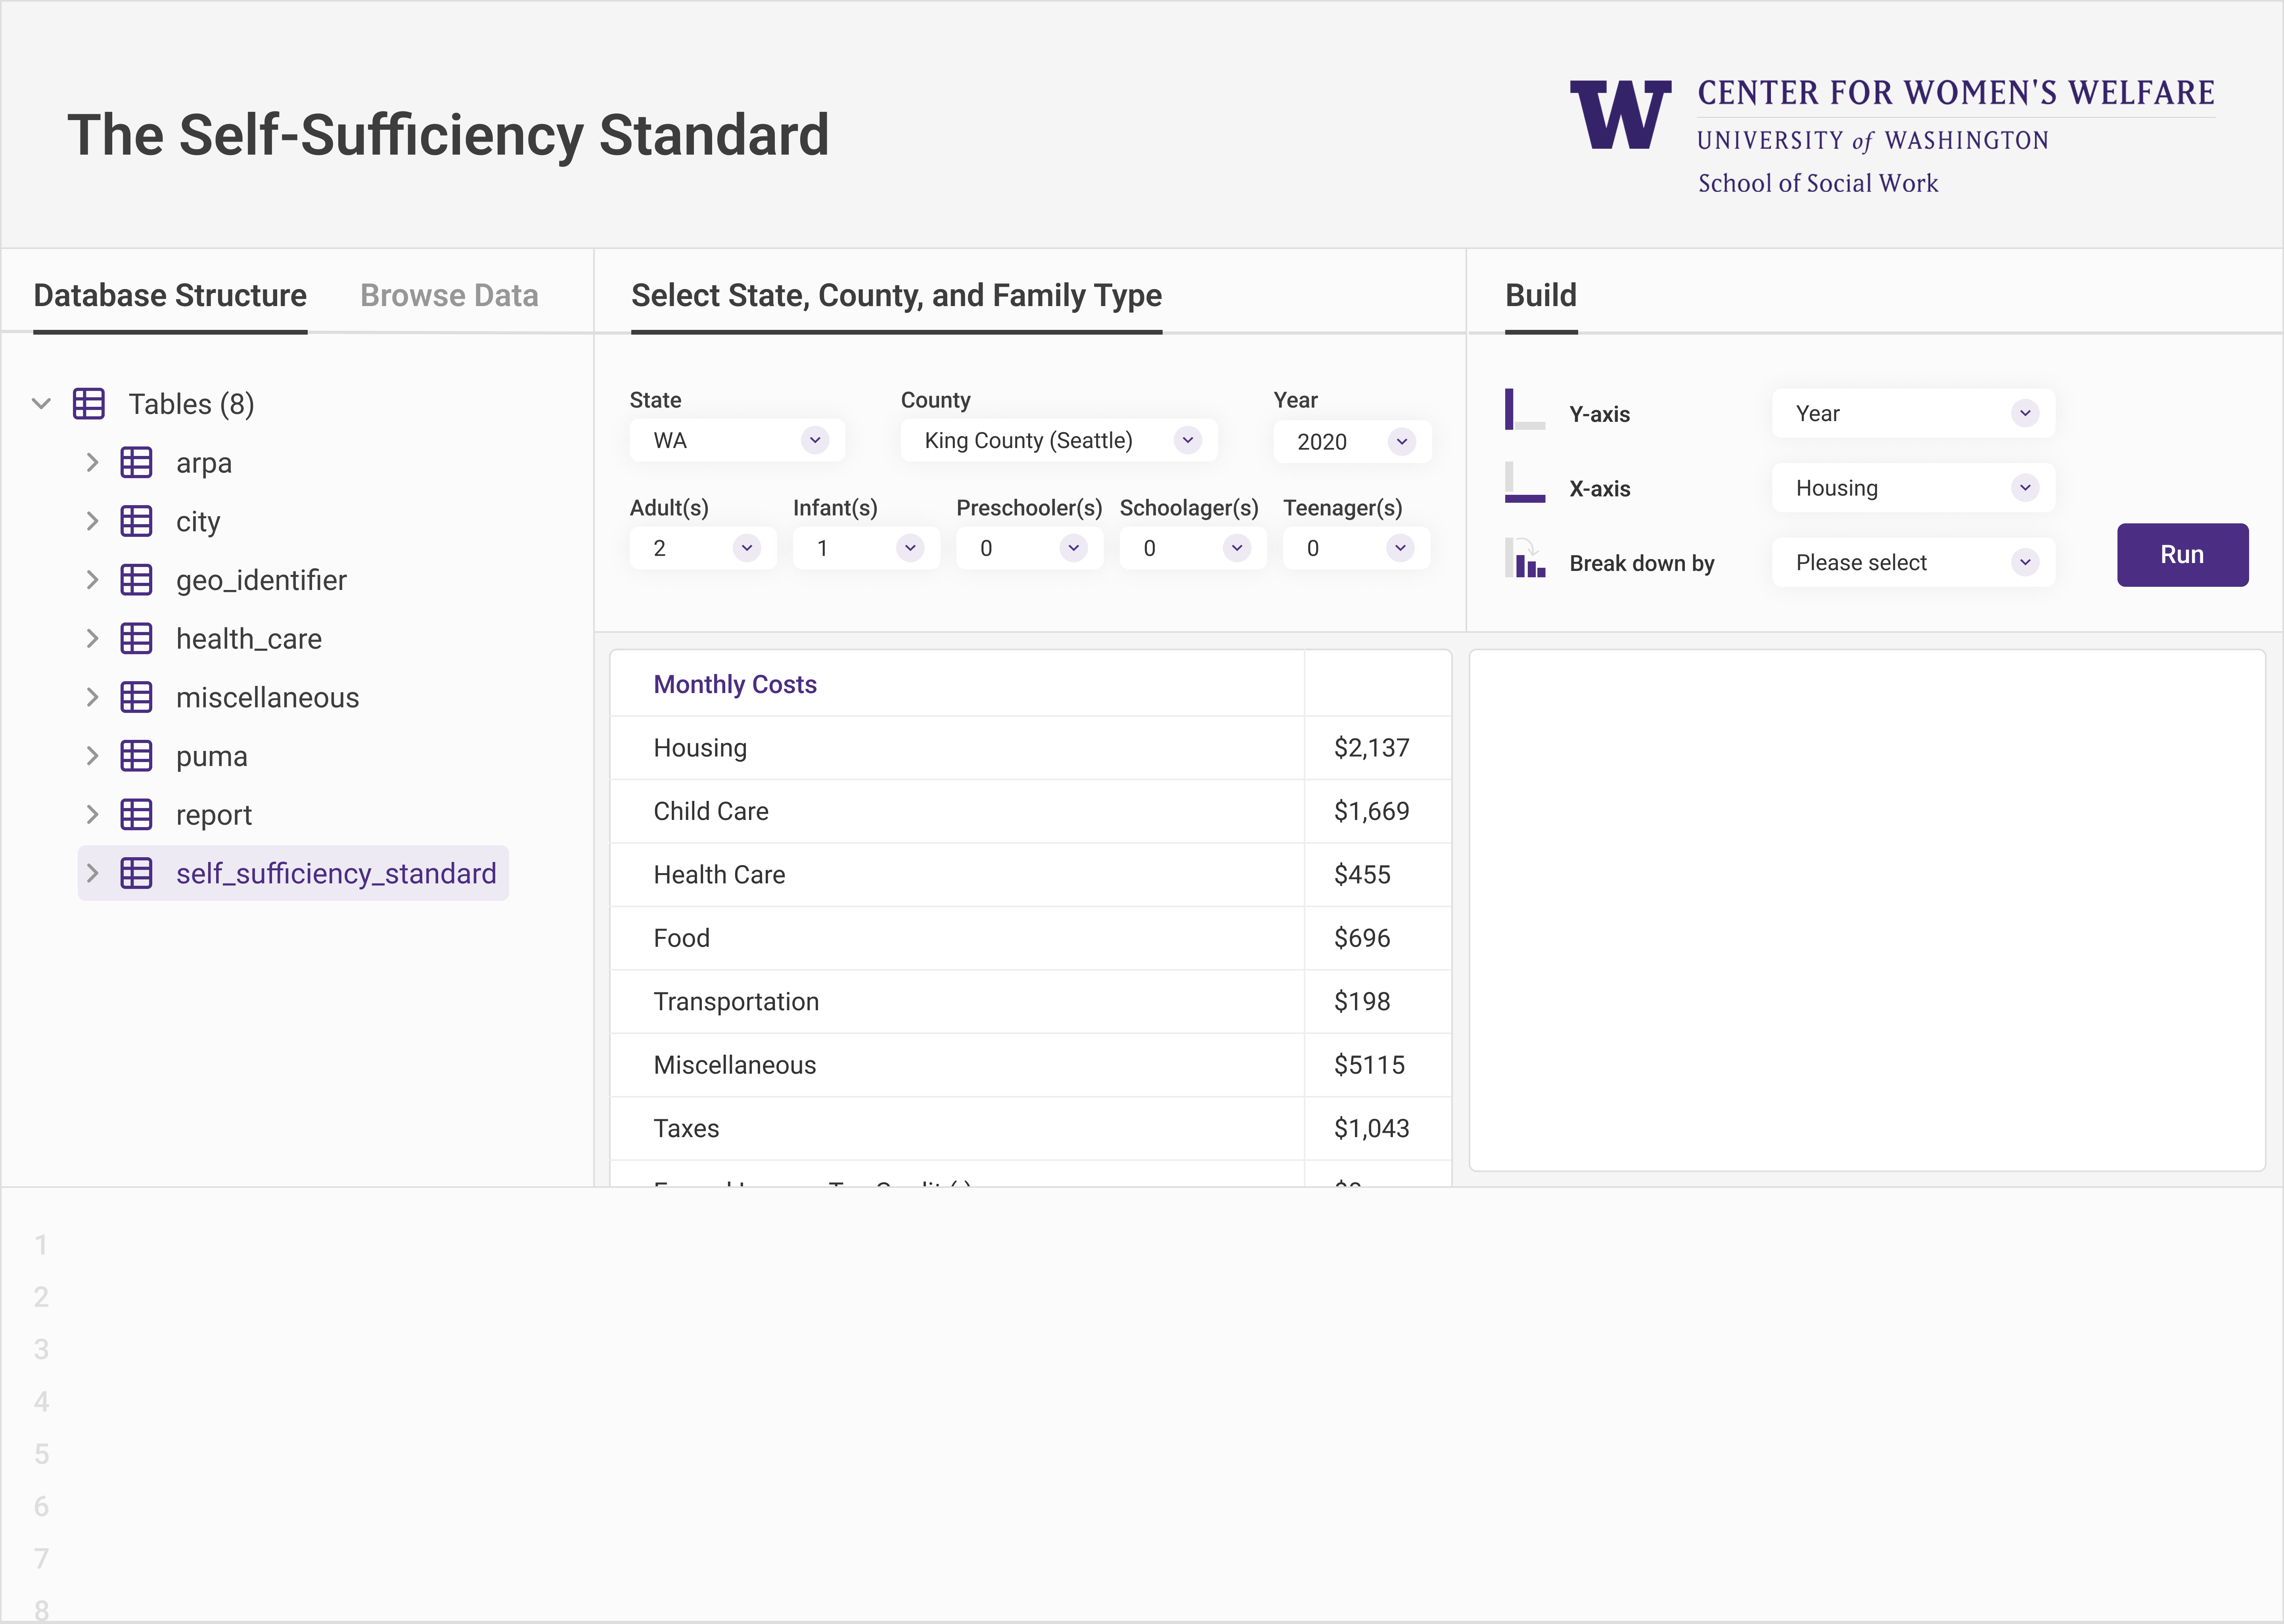
Figure 6: Dashboard view of the future online database