Methods & Processes
Tools
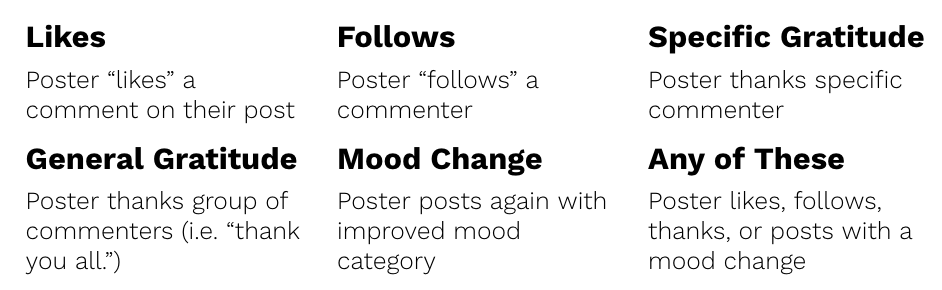
We have built a substantive pipeline in terms of accessing and dumping the data from the peer support platform. We have an extensive set of queries that can be run independently to generate dynamic user features and the set of outcomes that we hypothesize may correlate with our construct of interest (effective peer support). These outcomes are likes, follows, expressions of gratitude (a “thank you” directed at either a specific individual or a group of individuals), and positive mood transitions (where the original poster posts again but this time with a positive mood category). These queries are written in Microsoft’s SQL Server but can be run from a variety of tools, including Jupyter Notebook.
Once our dataset was created, a series of Python scripts tokenized and featurized the dataset. We used Python’s Natural Language Toolkit (NLTK) to generate measures of the sentiment and the Linguistic Inquiry and Word Count (LIWC) to create crude mappings of topic areas. These scripts were written both as interactive Jupyter Notebooks as well Python scripts.
The tokenized data was then sent to a machine learning pipeline that runs a lasso regression on all outcomes. This analysis is done exclusively in scikit-learn. Coefficients and findings are jointly analyzed with the t-SNE algorithm.
Processes
Data Collection/Access
The data was available via a Microsoft SQL (MSSQL) Server database. This was accessed primarily via Microsoft’s SQL Server Management Studio and SQL integrations with Python.
Data Exploration
Using the data access established using MSSQL, we explored the data to understand crucial statistics about users, the platform, and how engagement changed over time. This helped us develop a strong understanding of the database and its various tables. We also used unsupervised topic modeling to extract topics from the text (posts and comments). These topic models gave us a good feel for the kind of content circulating on the platform.
Data Filtering
During our data exploration, we realized that the platform contains a large proportion of content that is social media-related and lacks a mental health dimension. We decided to filter the data and only work on a subset that was related to mental health. For this we made use of metadata provided with each post regarding the mood and category of the content. We also utilized mental health-related trigger words and negative emotion words from the Linguistic Inquiry and Word Count (LIWC) database to extract the relevant content.
We additionally limited our analysis to post and comment pairs where the commenter was not the same user as the poster, thus eliminating posts where users received no comments or were the only ones commenting. While familiarizing ourselves with the database, we discovered some inconsistencies, errors, and problematic outliers that we also removed from our dataset. Lastly, due to time restrictions, we did eventually restrict our data to only those posts and comments created in 2018.
Data Cleaning and Preparation
We took further data-cleaning steps like word/sentence tokenization, fixing of data types, creating new binary columns to capture outcomes, etc. In the end, we were left with two datasets of approximately 2.2 million rows: one dataset containing features (predictor variables) and one dataset containing outcomes (our target variables that served as proxy measures of helpfulness).
Feature Engineering
After establishing a basic features table from the dataset, new language-based features were engineered. Linguistic Inquiry and Word Count (LIWC) word dictionaries were utilized to create features that identified topical aspects within the text like emotional affect, themes such as money or relationships, pronouns used, etc. This process was carried out in Python using regular expression matching to establish over 200 new features from the original text data.
Besides language-based features, statistics on user characteristics and dynamic measures of engagement were also included in order to control for the impact of these user-level features on our model outcomes. These were developed using complex SQL queries. Finally, in order to understand more about the use of counseling behaviors and techniques by peers on the platform, we also generated features that tagged the counseling technique used in a particular comment by a peer. These tags were generated in collaboration with Professor Mike Tanana from the University of Utah, using an existing classifier trained by him on counseling data that tags the use of motivational interviewing techniques based on utterances. These engineering efforts led to an expanded final features table.
Outcome Engineering
The biggest challenge we faced upfront was how to measure the helpfulness of comments on an online platform. In an ideal world, the following sources would have made for robust measures of helpfulness:
- Professionally annotated labels
- Surveys conducted with users providing a rating of helpfulness
- Periodic mental health assessments
However, we did not have access to any of these sources. Instead, we had to rely on proxy measures that we derived from social media indicators on the platform.
 These proxy measures came with their own set of challenges and problems that we acknowledge further in the Limitations section. Additionally, these measures, while frequent enough in the data, did not correlate very strongly to one another. The associated Cronbach’s alpha of these measures was 0.23, substantially less than the 0.6 threshold that is necessary for a questionable instrument.
Modeling
Our exploration of helpfulness involved the use of a logistic regression classifier, which incorporated lasso regularization. Our features (extracted from individual post and comment pairs) were the specific words that posters and commenters used as well as our dynamic user measurements. Our labels were drawn from different helpfulness proxies (the outcomes) we selected from the data.
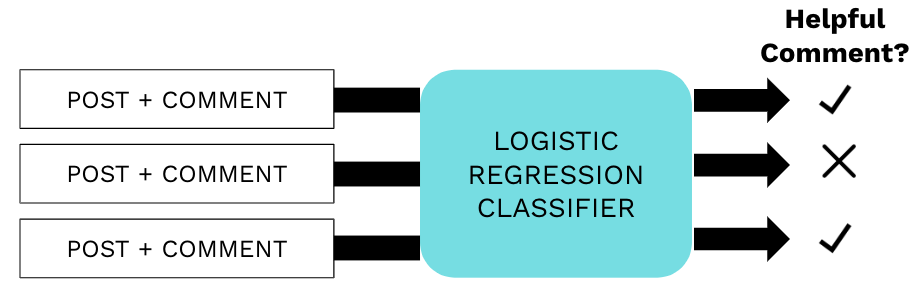 Our goal was to train a classifier that would be able to identify and predict which comments were helpful responses to posts and which were not. Then by looking into the classifier’s assignment of coefficients to different features, we would be able to extract some insights on which features contribute to helpfulness and in what way.
The models were essentially of two kinds: 1) simple bag-of-words, where the only features considered were a bag of words of the original text, and 2) expanded features, which contained a larger number of features generated by our team. The modeling pipeline was built such that every model run would output an automated report.
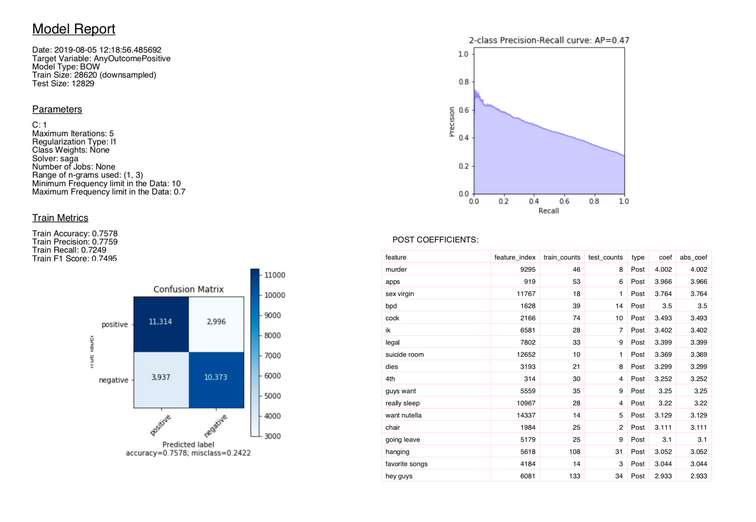 This report outlined all the model inputs, supplied the performance metrics on training and test sets, and provided a list of the most important features and their corresponding coefficients. This made it easy for model results to be shared across the team and viewed at different points of time, simplifying the interpretation process.
Interpretation
Model interpretation was carried out using the feature coefficients output by our models. The features with large coefficients were studied carefully by diving back into the original data to understand the context in which the features were showing up. This process allowed for important insights to be drawn from the data.
Inference
Based on the model interpretations and findings, our team arrived at a set of inferences regarding our original research question.