Results
Point-in-Time
Under the point-in-time approach, we implemented 3 different household definitions in April 2010 (the month of 2010 Decennial Census) and November 2014 (one of the highest number of recorded addresses). In the absence of ground truth data, it is challenging to benchmark our results. As the underlying data and counting measures are different between Census and WMLAD, the raw counts are inevitably different. Instead, we focus on the ratio of household sizes as a better comparison. We compared all households and family households against 2010 Decennial Census data. Both state-level aggregates and tract-level distributions are evaluated.
Comparing All Households
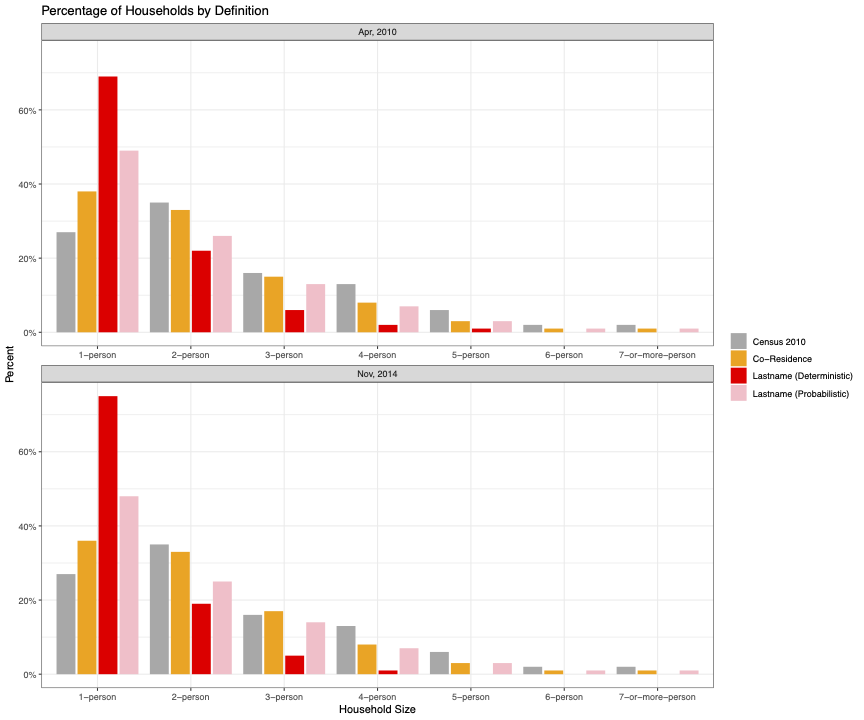
As the graph above shows, naive co-residence method results closely mimic Census definition of households.The discrepancy between one-person households is observed because WMLAD has limited data on children. For instance, single parents with a child are most likely labeled as one-person households, as the information of the child was not included in the WMLAD. This problem inevitably leads to undercounting higher size households, some of which are parents with missing children info.
As expected, the deterministic lastname method significantly overcounts one-person households. Consequently, higher size households are heavily underrepresented. Note that, deterministic lastname method doesn’t try to match the Census counts. Please, refer to the methods section for the details.
On the other hand, the majority of the difference introduced by the deterministic method is mitigated by the probabilistic assignment of households into families based on the underlying Census tract counts. When comparing all household types, the Naive Co-Residence method performs better against Census. Lastly, the distribution of households by size doesn’t change much between 2010 and 2014.
Comparing Family Households
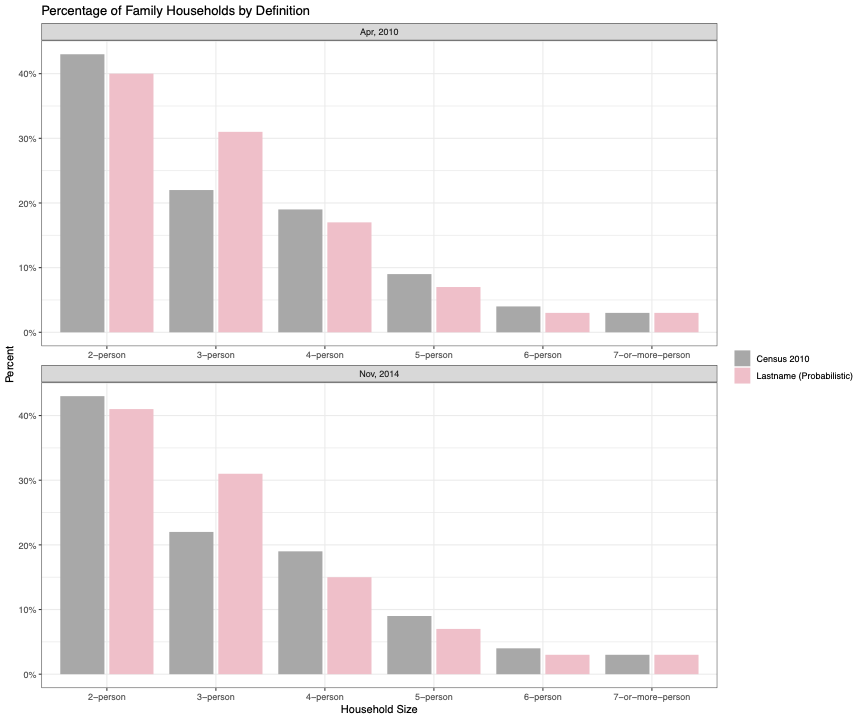
When compared to the distribution of Census family households, the probabilistic lastname method results in close estimates for 2-person, 6-person and 7-or-more-person households. Probabilistically assigning households into families resulted in a distribution that closely aligns with Census. However, we are overcounting 3-person households and undercounting 4-person households. Lastly, the difference between two time points is negligible here too.
Spatial Patterns
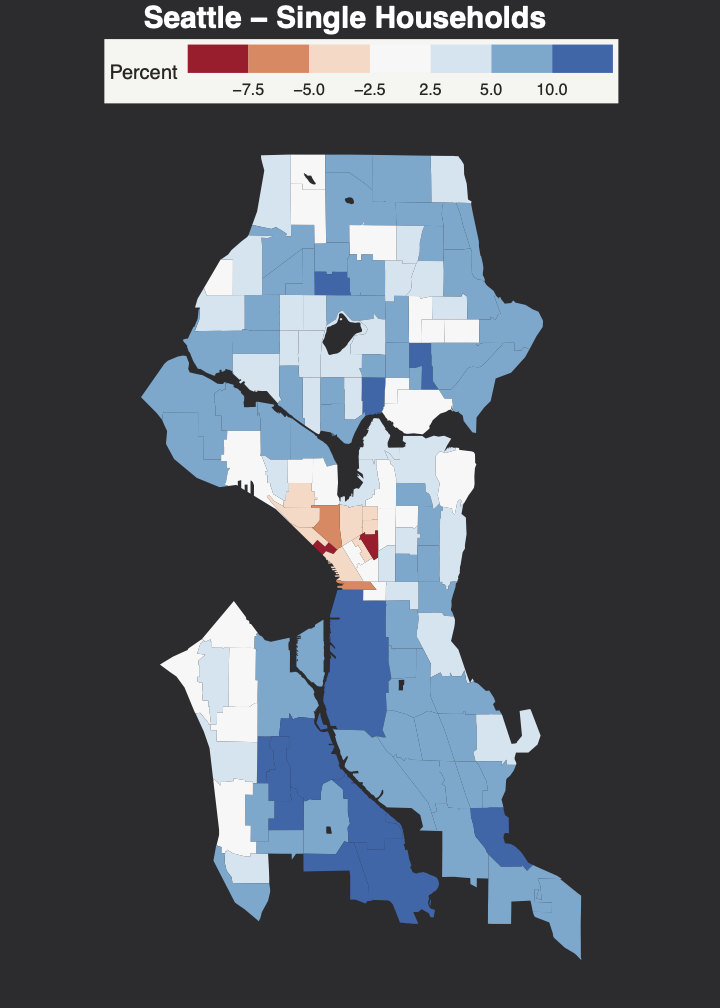
The above map shows the difference between single households in WMLAD and Census 2010. The blue shades indicate the tracts where WMLAD overcounts one-person households, whereas red shades present the undercounts. The percent difference of white tracts are in the margin of error. The results show that Naive Co-Residence method overcounts single-households in most of the tracts which is due to limited data on children. However, it’s still undercounting the downtown Seattle area where single households are very common. The next section will evaluate single-person households in a longitudinal method.
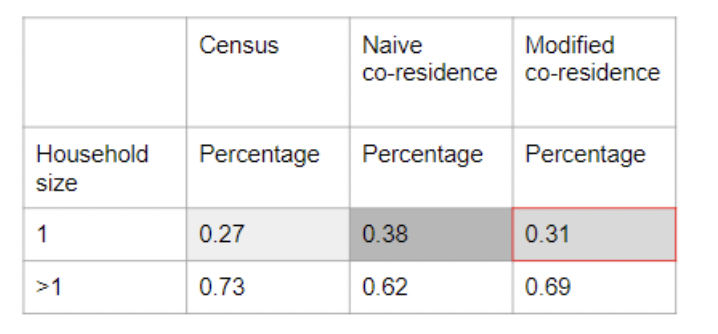
Longitudinal
After implementing the modification algorithm and removing duplicates, the proportion of one-person residences decreased from 38% to 31%, which was closer to the census data.
Deliverables
We produced the following deliverables as a part of this project:
- PostgreSQL database with clear schema
- Longitudinal household file modifying certain anomalous cases of one-person households for April 2010
- Point-in-time (April 2010) household file on the individual level with their household ID for each definition (naive, last name deterministic, and last name probabilistic)
- Point-in-time household files, one for each definition, with each household ID and its characteristics
- Summary tables of the distribution of household sizes for each definition
- Summary maps
- Documentation of the code, workflow, concepts, and analysis
They will be used by future teams working to improve the household definitions and by future researchers working on using the existing definitions for their analyses.