Results
Deliverables
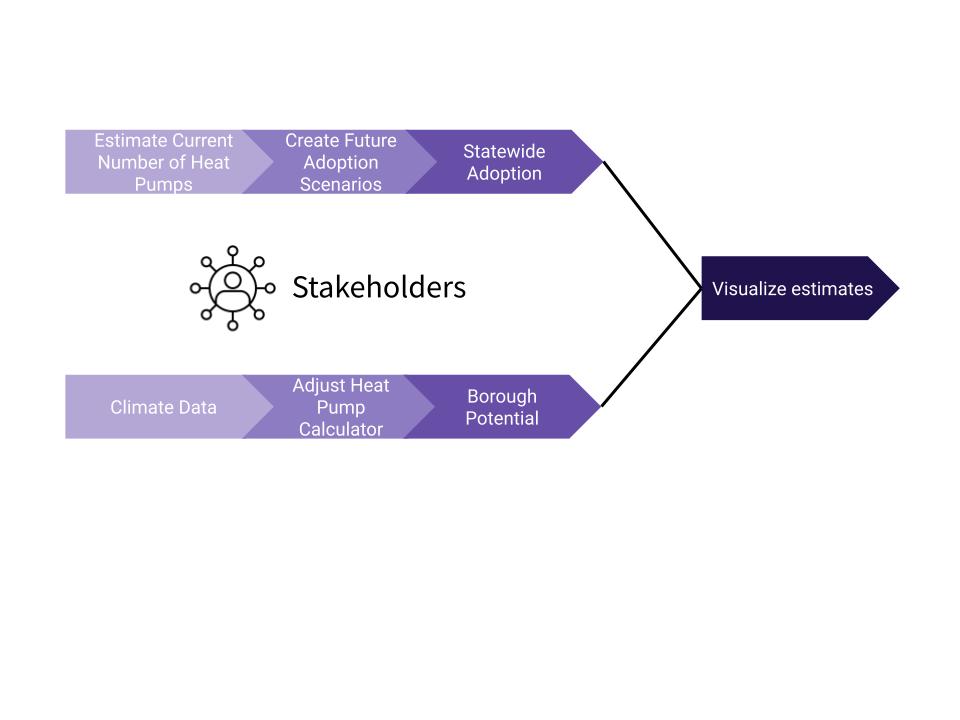
As our primary project deliverable, we built an interactive, accessible, and openly available visualization dashboard. The dashboard is an online tool that enables users to understand the impact of heat pump adoption at state-wide and borough levels. We invite you to visit our dashboard to explore how heat pumps might be distributed among boroughs, how different heat pump adoption rates would affect state-wide economic, feasibility, and carbon emission outcomes, and how these outcomes vary based on different future fuel price, subsidy, and climate change scenarios at the borough-level.
Three aspects of our visualization tool were central to us as we were designing it. First, it was important to us that the tool is interactive, allowing users to actively engage with how different scenarios affect the visualizations and explore different features of particular interest. Second, we designed our tool to be accessible to a wide range of audiences. While we developed it with a primary audience of policy makers and NGOs in mind, we hope that our tool is accessible to a range of both technical and non-technical audiences. To achieve this, we ensured our visualizations both conveyed the relevant information (for example population rather than geographic space) while remaining clear and easily interpretable, and presented information in multiple presentations styles (e.g., maps, numbers, and bar charts). Finally, it was important to us that both our tool, workflow, and code was freely and easily accessible online. We hope stakeholders interested in contributing to the project can easily access our workflow to build on and extend our project. Ultimately, we hope that this tool will empower policy makers and NGOs to implement policy changes to accelerate the adoption of heat pumps in Alaska.
“The UW Data Science team did an excellent job developing an app to explore aggregate heat pump adoption scenarios in Alaska. The simple user interface and Tilegram visualizations of results make the application approachable and informative. Many thanks for their contribution to heat pump analysis in Alaska!”
- Alan Mitchell, Energy Analyst & Founder of Analysis North
Findings
While the focus on interactive exploration in our dashboard allows users to come to different findings based on their interest, we identified three striking takeaways from the data. First, for 18 out of 30 Boroughs, 97% or more of total heating days can be covered by heat pumps. Heating feasibility is a primary concern and barrier to heat pump adoption in Alaska, so this finding is especially important. Second, an increase in rebates and subsidies would make a critical difference in terms of the cost-effectiveness of heat pumps; for example, the Inflation Reduction Act (~$2,000 incentive) would “tip the scales” and make heat pumps cost-effective in five boroughs in which heat pumps are currently not cost effective. Finally, our data indicates that if Alaska reaches the national average of a 15% heat pump adoption rate, more than 140 million pounds of CO2 can be saved state-wide. Together, these findings suggest that in most boroughs in Alaska, switching to a heat pump as a primary heating source would be feasible and cost-effective for an average household, especially as planned government subsidies are offered and as fuel prices increase. The immense carbon reduction from increased heat pump adoption will contribute to the increasingly important goal of decarbonization and combat climate change in arctic regions.
Our work is a blueprint that can be expanded upon. This blueprint is outlined below.