Overview
Teaching: 10 min Exercises: 20 minQuestions
How do I plot the results of spatial queries on a map?
Objectives
Learn about the various options for visualizing geospatial datasets.
Plotting your data on a map:
- Download the QGIS software
- Run the software and connect to the database:
- click on “layer/add PostGIS layers”
- click on the “new” button and enter the connection information (similar to what you did in exercise 1 for the pgadmin software)
- click on the “connect” button
- you should now see the database tables we’ve been working with. Add one of these and it should appear on the map.
- Things to explore next:
- change the symbology of the points, coloring them by a specific attribute so that the colors illustrate grouping in the data
- add a background map
web\QuickMapServices\OSM - issue the SQL query you built above to select only those points within 1 km of a point
- click on
database\DBmanagerand you will see the database to which you have already connected. - issue a SQL query in the SQL command window (blue arrow in this screen capture):
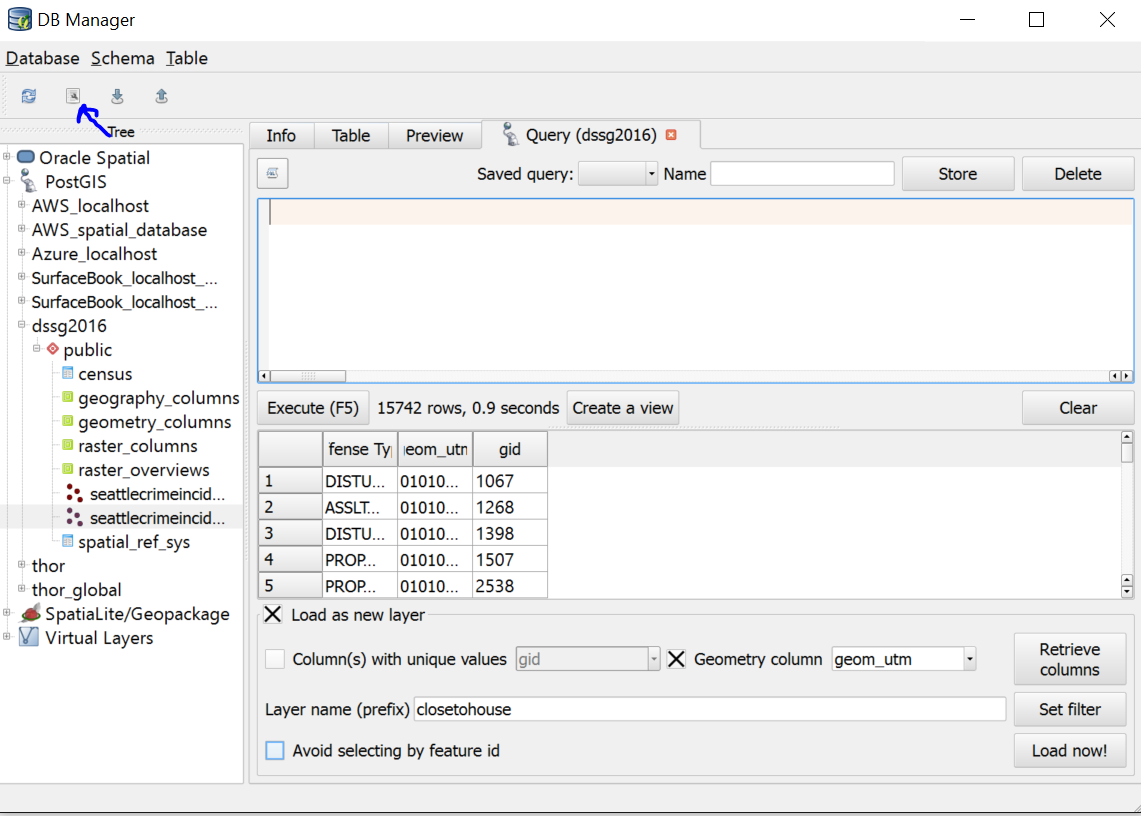
- click on
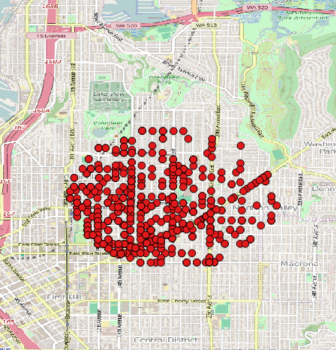
Challenge: Try to make a map like this!
Additional resources
- Geopandas is a Python library that can be used to manipulate and plot vector geospatial data
- Visit our geohackweek tutorial on Geopandas for more information and examples.
Key Points
GIS software provides a graphical user interface for running geospatial queries and making maps of the results
QGIS is a particularly good software for interfacing with PostGIS