Introduction to GeoNdxR
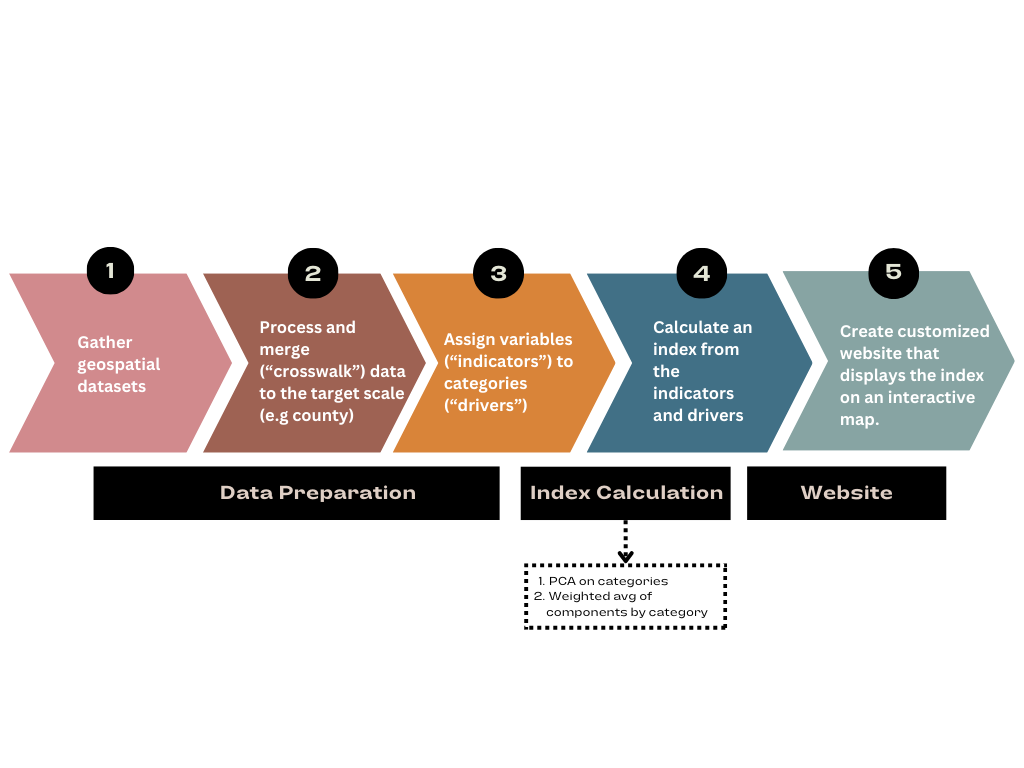
GeoNdxR is a set of generalized tools that we created in the process of cleaning geospatial data at different scales, reducing redundancy across different indicators, and presenting the final index in a convincing and intuitive format. Users can access GeoNdxR, i.e. our R programming pipeline, available on our GitHub Repository (download or clone in its entirety). The diagram below shows our generalized approach to creating a geo-spatial index.
What exactly is GeoNdxR?
geondxr is a low-code tool (pipeline via a GitHub Repository) that enables R users to create custom-made, dynamic websites showcasing a geographic index.
geondxr helps R index creators pre-process the data they want to include in an index, calculate the index, and map it. From there, Creators can make their index website available to web users as an .html file that can be hosted on a service like Github pages. The index website includes a user interface that enables web users to tweak the default index generated by the creator based on variables they are interested in and to zoom in on their specific local area.
geondxr uses WebR to deliver computation (like index re-calculation and interactive mapping based on user-selected variables) directly in the web user’s browser, making it drastically easier for index creators to build and host a website containing their index. This ensures the longevity and affordability of the resulting dynamic websites (it’s free!).