Motivation
Project Goals
There are two main goals of this project:
- Create a tool that allows web-creators to generate their own website which shows their index of interest, maps it on the US map at varying geospatial scales. End audience will be anyone who faces the website rendered by web-creators. Since different audiences deem certain indicators of the index more important than the other, this website allows audiences to choose their own combination of indicators that they consider significant when constructing the final index.
- Use this tool to create a website for stakeholders in the water sector to assess and prioritize areas based on their potential benefit from investing in water reuse infrastructure.
Deliverables include:
- Index measuring potential benefits that communities can get from water reuse.
- Visualization of that index through mapping
- User interface and generalizable R code that allows users to choose their own components of the index and to map it
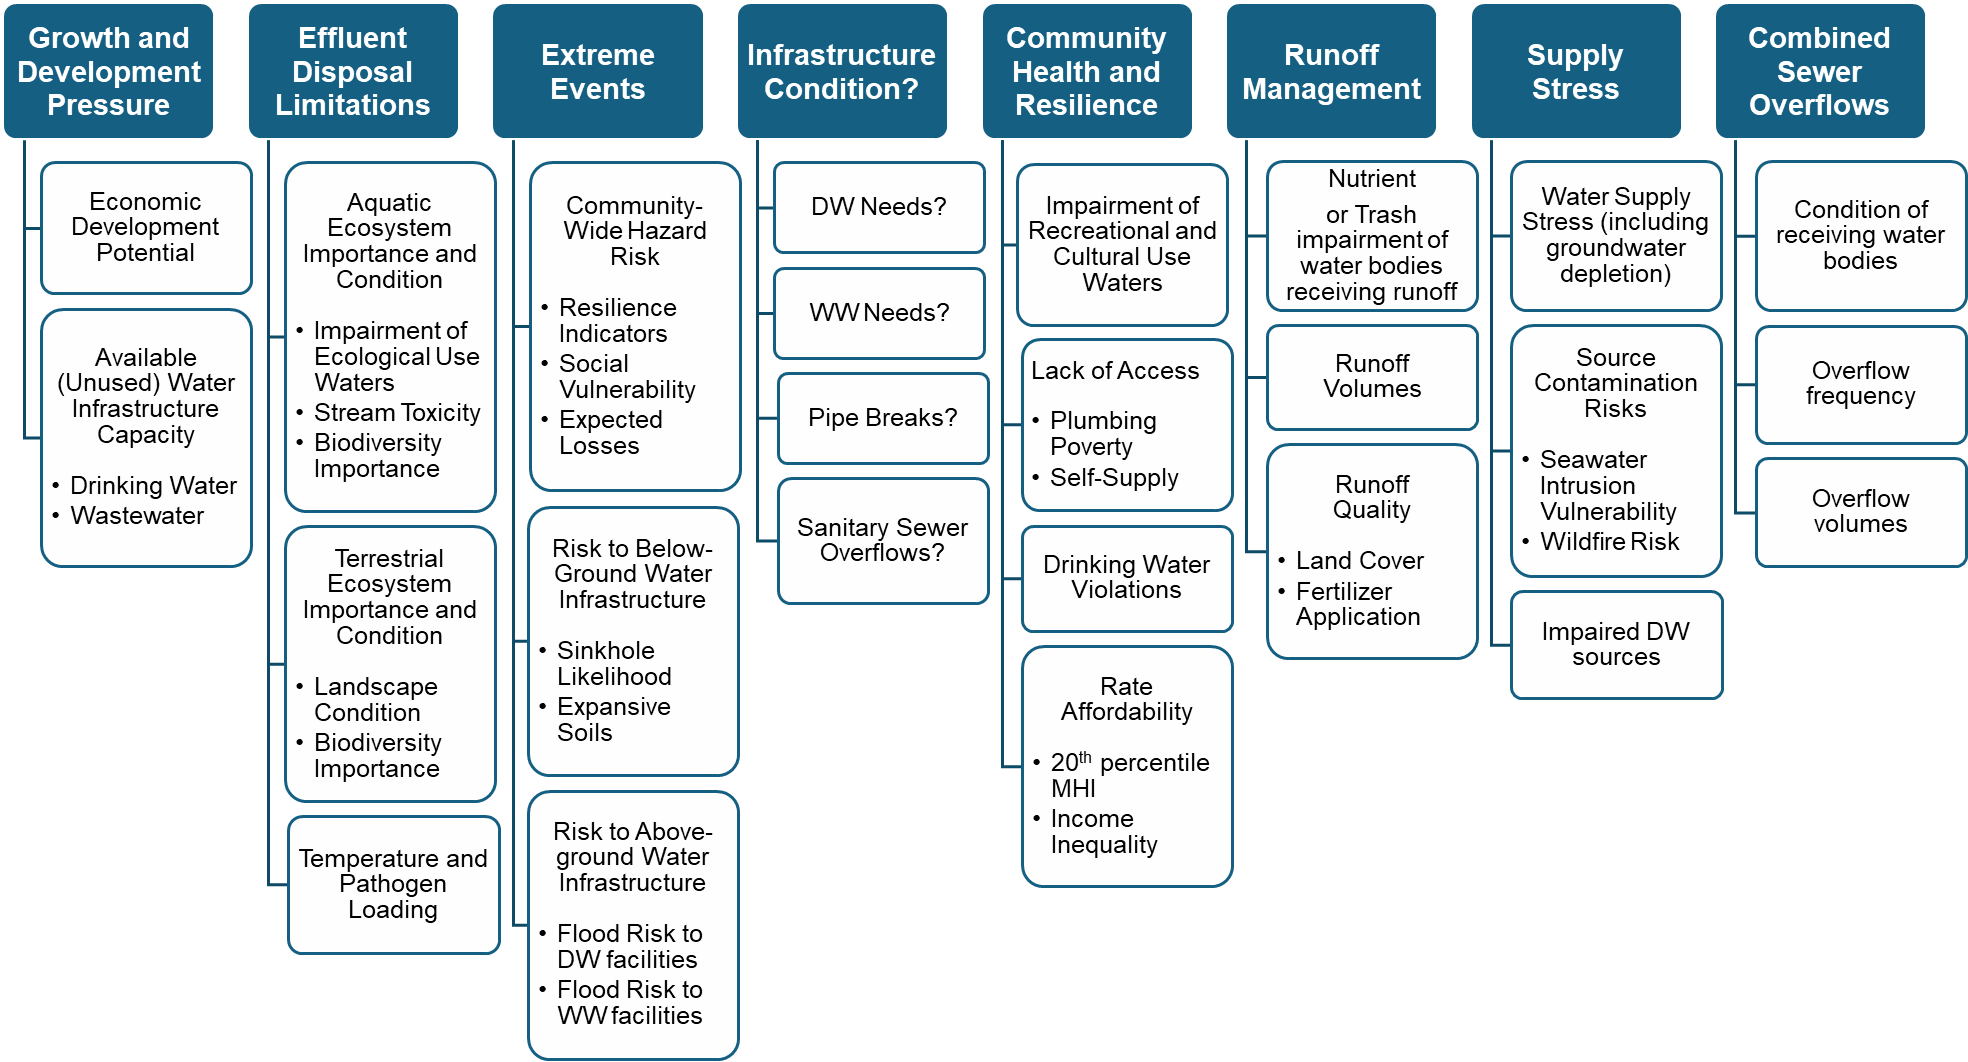
We believe that communities are motivated to explore water reuse due to the significant environmental and economic benefits it offers at both utility and household scales. Our project leads, who are experts in water reuse, have identified a comprehensive set of drivers, including effluent disposal limitations, extreme weather events, community health and resilience, and runoff management. These drivers, represented in the top row of boxes, are assessed using measurable indicators, shown in the white boxes below, to determine their severity. Understanding local water needs and the potential benefits of adopting water reuse is complex, but there is a wealth of publicly available data, such as from the U.S. Census Bureau and the Environmental Protection Agency, that can help piece together a comprehensive picture.
Ethical Considerations
Q) Anyone can create any type of index. What do we make of it?🤔
- We’ve had a discussion on potential perils of tool that is too general. With this tool, it allows any stakeholders in any fields to create their own index, making it vulnerable to potential manipulation. We explicitly addressed difficult use cases like selection of a biased set of indicators to get the index they want to use. With a series of discussion and feedback from stakeholder engagement interviews, we learned that communities and various interest groups have already been using various tools to portray themselves in ways that favor them. Our tool can indeed empower under-resourced communities to make a more compelling cases to decision makers by utilizing data-driven index and its intuitive visualization. We further decided not to offer the option of adjusting weights assigned to indicators as a default feature. This can mitigate the concern of tuning the index value by arbitrarily changing the weight assigned to constituting indicators.
Q) How do we empower technically less experienced users to the greatest extent?
- We have spoken with lots of subject matter experts in the water reuse field, who do not use data analyses much in daily tasks. We thought it is important to make sure that our products can reach the public beyond the data scientists. To address the concern, our website allows end-users to interact with the index by selecting what goes in to calculating the index, and allowing them to download the re-calculated index.
Q) Why PCA over othe dimensionality-reduction methodologies?
- After a robust literature review, we have explored different options of calculating index. While there were many compelling methods like archetypal analysis, ToxiPi, we decided to provide weighted-average PCA as a default. This is because PCA provided the most transparent pipeline and allowed subject-matter expert (web-creator) to assign weights.
Q) Should we consider all wastewater to have water reuse potential?
- We need to consider water rights, as some water has to return to waterbodies. There are downstream communities that rely on treated water as their drinking water.
Stakeholders
| User Group | Description |
|---|---|
| Creator | Using R code, we publish: • Decide which variables go into the index (must be clean & processed) • Specify weight received by each variable • Specify how index is calculated • Run a script that creates HTML, JS, & R code they can publish as a website (audience is web users) |
| Web Users | Engage with the website, where an interactive map and index creation tool are located. |
Check out our use cases below ⬇️
| User Group | Description | Needs | Skills/Experience |
|---|---|---|---|
| Water reuse researcher (Carolyn) | Carolyn researches water reuse; wants to create an index quantifying potential for reuse across US counties | Provide cleaned datasets; use output to map index, make a visualization of that input (map) available to nontechnical users via a website | Ability to load datasets; checks notifying whether datasets are in a format that GeoNDXR can work with; clear functions & workflow to output HTML pages; clear user guide specifying her options with the output. | High, focused in R; wants streamlined features to enable focus elsewhere (she doesn’t want to do web dev) |
| Data journalist (Sarah) | Sarah is a data journalist for a major media company; she supports traditional journalists who want to supplement stories comparing regions in the US with data | Provide cleaned datasets; use output to map index, make a visualization of that input (map) available to nontechnical users via a website | Ability to load datasets; checks notifying whether datasets are in a format that GeoNDXR can work with; clear functions & workflow to output HTML pages; clear user guide specifying her options with the output; ability to customize output; transparently explain how indices are calculated | High; focused in R; wants a streamlined workflow for index generation but also needs flexibility |
| Economic policy analyst (Mike) | Mike is an economic policy analyst for a think tank. He wants to create a regional index displaying how a custom inflation metric has risen differently across parts of the US | Provide cleaned datasets; use output to map index, make a visualization of that input (map) available to nontechnical users via a website | Ability to load datasets; checks notifying whether datasets are in a format that GeoNDXR can work with; clear functions & workflow to output HTML pages; clear user guide specifying her options with the output; ability to customize output; transparently explain how indices are calculated | High; focused in R; wants a streamlined workflow for index generation but also needs flexibility |
| Climate policy researcher (Joe) | Joe is a climate policy researcher at a university. He wants to aggregate different climate risks, produce an index, and make a visualization available to nontechnical users on his GitHub to showcase his work | Provide cleaned datasets; use output to map index, make a visualization of that input (map) available to nontechnical users via a website | Ability to load datasets; checks notifying whether datasets are in a format that GeoNdxR can work with; clear functions & workflow to output HTML pages; clear user guide specifying her options with the output; ability to customize output; transparently explain how indices are calculated | High; focused in R; wants a streamlined workflow for index generation but would like flexibility in display options, optimized for GitHub |
| Data science job market candidate (Daniel) | Daniel is a data science master’s student looking for jobs when he graduates. He is interested in aggregating different metrics, e.g., election polling results, to make predictions about elections. He wants to create an index to predict each congressional district’s outcome in the presidential election (based on more than just polls) and make a clean visualization available on GitHub to showcase his work | Provide cleaned datasets; use output to map index, make a visualization of that input (map) available to nontechnical users via a website | Ability to load datasets; checks notifying whether datasets are in a format that GeoNDXR can work with; clear functions & workflow to output HTML pages; clear user guide specifying her options with the output; ability to customize output; transparently explain how indices are calculated | High; focused in R; wants a streamlined workflow for index generation but would like flexibility in display options, optimized for GitHub |
| EPA employee | He needs an interface that he can use to find locations that need water reuse facilities the most. He wants an interactive interface that he can use to study and understand the need for water reuse infrastructure in various places in the US. | He has no programming experience | |
| Utility Employee (Aisha) | Aisha is an employee of a utility company that is considering expanding into the water reuse area. | She wants to see places that are in dire need of water reuse. She needs an interactive application that she can use to visually see these places and give valuable recommendations to the company. | She has no experience in R coding |
| Community member | She heard about water reuse and is inspired by it. | She wants to learn more about it. She wants a less complicated and easy-to-understand web application interface that she can easily use to view the water reuse needs of different US counties and the reasons for this need. | She has no programming and industry knowledge |
| XYZ Water Reuse consultancy firm employee (Betty) | One of the consultancy clients is a utility company that is considering establishing a water reuse facility. | Betty wants to build a credible interactive web application index that she can use to view places in absolute need of water reuse facilities and the profitability potential of these facilities. | She has technical and industrial knowledge. |
| Researcher | She needs a tool that she can use to create a feasibility index and display them on an interactive web application. | She wants to build a water reuse feasibility index, where she can incorporate economic, environmental, and technical feasibility measures. | She is proficient in R |
| Gambia National Water and Electricity Company (NAWEC) Employee | The utility company is planning to build an index that will help them identify the regions in need of wastewater treatment facilities. | As the analyst at the company, he needs a tool that he can use to create the index and display it on an interactive web application. | He has years of experience working with data and R. |
| Data scientist (Curtis) | Curtis is a data scientist at eScience Institute. | He would like to be able to build some cool tech that he can teach to other technical people at the eScience Institute in order to make their work better. This means that he needs a fully functioning pipeline that does something nifty and is well-written both in code and comments. | He's super technically proficient. |
| Journalist (Kendrick) | Kendrick is a journalist working for 538. | He wants to be able to show the relationship between an index that he is interested in (industrial jobs) and changes in polling in the presidential race since JD Vance was nominated as VP. He would like to be able to overlay an explorable index and a different variable so that the geographical relationship becomes obvious. | He is a proficient technical user with experience cleaning data but a busy journalist. |
| Suzannah, college student | Suzannah is a college student with a slight smartphone addiction. | She got really upset that Seattle wasn't the "most livable" city in the recent Zillow livability index and wants to know what factors were included and how that would change if there were different factors included. She would like to be able to save her index that shows Seattle to be the most livable city. | She spends most of her time at a lab bench and isn't very familiar with data analysis, except for that one stats class everyone had to take. |
| Zach, researcher | Zach is a researcher studying a new way to learn about homelessness that he thinks will work best in areas of a certain type. | He would like to quickly throw in some census data and find places similar to and different from Seattle to test this new process. He wants to be able to use that as a part of a grant application. | He is highly technically proficient. |
| Gates Foundation Employee (Sam) | Sam works at the Gates Foundation, which is giving money to different projects that meet some threshold of need and positive impact. | He wants to be able to easily adjust an index to represent different needs and interactively show the impact the project will have. Sam also wants to be able to make modifications on the fly and export the results in a web-readable format. | He is highly proficient with R. |
| Sales (Kathryn) | Kathryn works in sales for a company that sells wastewater equipment. | She wants to be able to use an index to visually identify regions that are in absolute need of wastewater equipment. | She has technical and industrial knowledge. |