Summary
Satmetrics, at a high level, performs three steps to detect and quantify satellite streaks. The first step is to detect straight lines in an image, which are likely to represent possible streaks. To accomplish this, we apply the Hough Transformation method1, a widely used algorithm to detect straight lines in computer vision. The astronomical images sourced from multiple telescopes are quite heterogeneous in terms of the noise present in them. Consistently removing this noise across a variety of images in a generalizable way is the key challenge at this step. We therefore apply several standard image processing techniques such as background reduction, outlier removal, blurring, and edge detection to prepare the image for Hough transformation. This stage outputs one or more estimated straight lines, clustered into groups. Each cluster represents either a single streak or a noise detection.
The next step is validation to distinguish actual streaks from noise. At this step, the tool measures the median pixel intensity values of the average line in each cluster returned from the first stage. We expect the streaks’ median pixel intensity to be approximately Gaussian, and proceed to fit a Gaussian function to differentiate noise from actual streaks. This requires isolating and rotating the parts of the image that contain candidate streaks.
Once validated, the final step is to measure the properties of the streaks. Currently, Satmetrics provides basic information about the streak such as the amplitude of the pixel intensity representing the height of the streak, its brightness scaled to the pixel level in the image, and the width of the trail. The brightness measurement that Satmetrics outputs is not a calibrated photometric magnitude but is a foundation to begin the kind of brightness analysis work astronomers would want and are capable of doing from the package.
All of these processes are described in detail in the following sections.
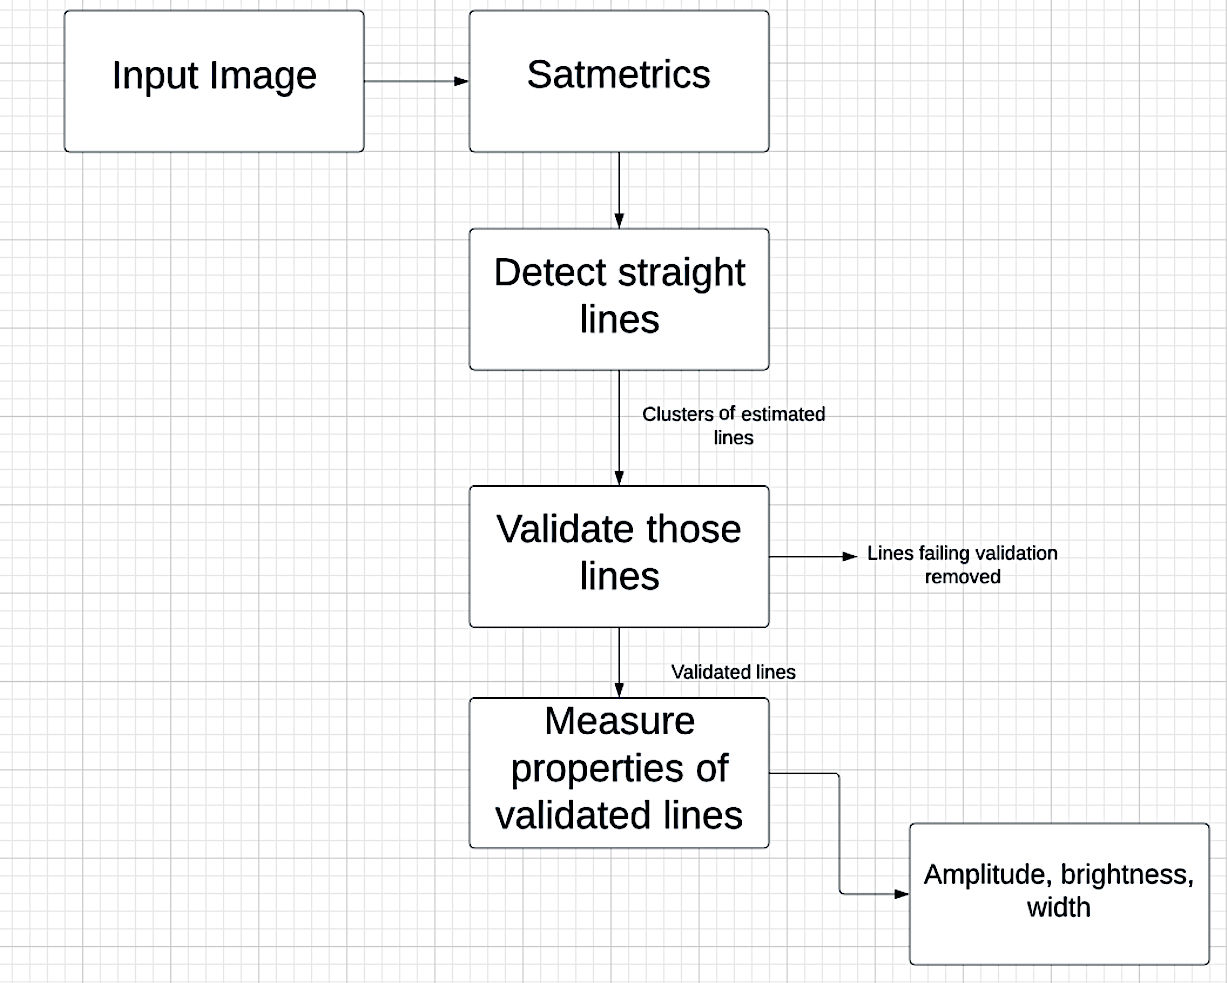 Flowchart illustrating how the Satmetrics library processes astronomical images to detect, validate, and measure properties of satellite streaks
-
https://scikit-image.org/docs/dev/auto_examples/edges/plot_line_hough_transform.html ↩