Validation of Estimated Lines
Validating a streak involves taking the median intensity pixel values of each row of an image containing a streak to obtain the profile of that image. This analysis is most efficient when the streak is horizontal. Therefore before the algorithm before validation analyses, it rotates all streaks in an image such that they are horizontal.
Rotating One Line
The rotation algorithm rotates an image by each cluster of hough lines determined. In some cases, an image only contains one cluster with a single hough line. The algorithm starts by finding two Cartesian coordinates for each estimated line since the detection algorithm returns information about estimated lines in polar coordinates. The two points found are where the line enters and exits the image, or the edge points. These edge points are used to calculate the slope, and we estimate the angle of rotation by taking the inverse tangent of the slope.
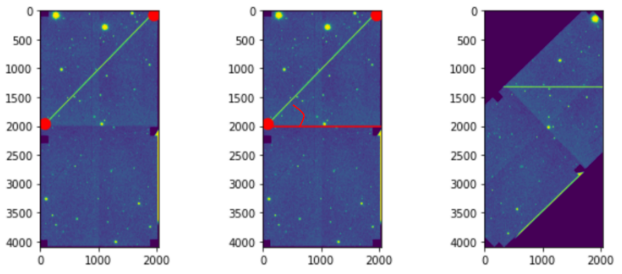 (Left) The endpoints of the detected line in the image. (middle) The slope calculation of the line. (right) The image after it has been rotated
Before rotating the image, an anchor point is set to accurately determine the location of the streak after rotation for easier cropping methods. The anchor point is determined to be the midpoint of the line.
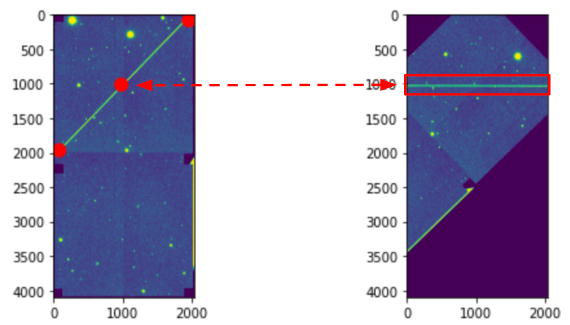 The anchor point of the estimated line (left) and the resulting rotation based on the anchor point (right)
Finally, the image is rotated and cropped to isolate the streak into its own smaller image.
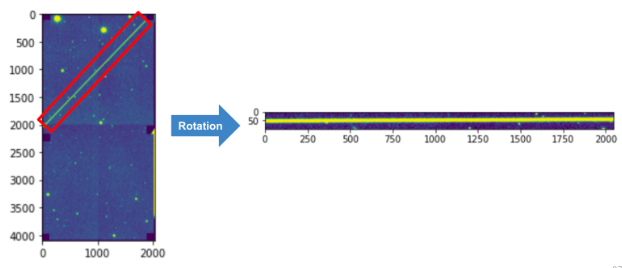 The image illustrates the estimated line (left) and its rotation and subsequent cropping (right)
Rotating multiple lines
In cases where a cluster contains multiple lines, edge Cartesian coordinates are found for each line in the cluster. The entrance Cartesian coordinates are averaged to obtain a mean entrance and exit Cartesian coordinates.These two Cartesian coordinates are used to represent an average Hough line of all the Hough lines in the cluster. Using these two points, the algorithm performs the same calculations as those mentioned in ‘Rotating One Line’
Cropping
Images are cropped fifty pixels above the center and fifty pixels below the center, for a total of 100 pixels on the y-axis. To reduce error in validation, the image is cropped along the x-axis if the distance between the edge points is greater than the width of the original, unrotated image.
Median Pixel Intensity Values
After the image has been rotated and the streak has been isolated, we can now plot its pixel intensity values. This allows us to visualize the location and intensity of the brightest object in the image.
We consider the median of the pixel values because streaks consist of clustered and extended pixel intensities, so the median offsets any outliers such as background noise or other bright objects that aren’t streaks. When we plot an image that doesn’t contain a streak, the result is a series of noisy, narrow peaks. Whereas when we plot an image that does contain a streak, the result is a single dominant peak that looks approximately Gaussian. We therefore use a Gaussian as our fitting model in order to determine whether or not we detected a streak in the image.

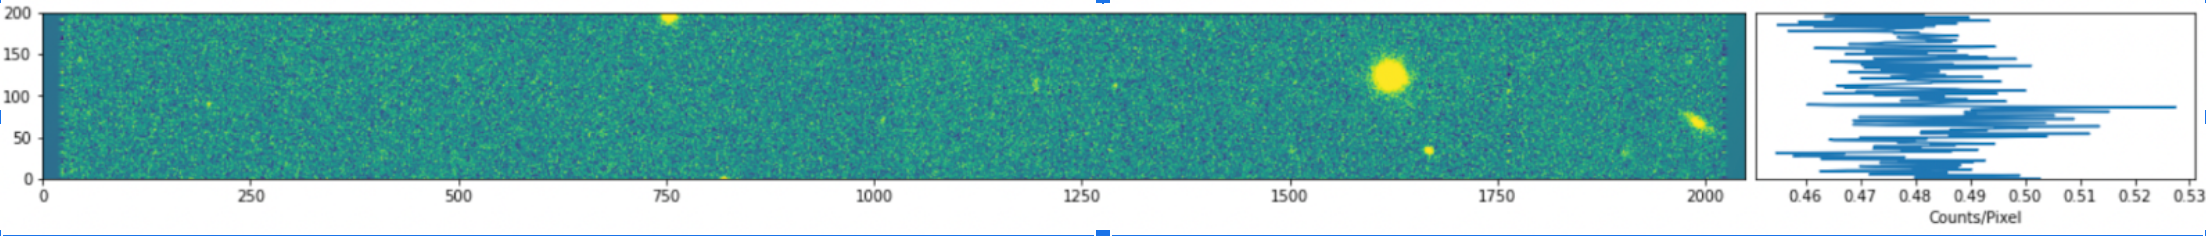 When no streak is present (top), the median pixel intensity plot to the right is noisy with many narrow peaks. When a streak is present (bottom), the median pixel intensity plot to the right shows a single coherent Gaussian-like peak. We leverage this difference to validate when we successfully detect a streak
We only want to measure the image data when it contains a streak. When we try to fit a Gaussian to a brightness profile of an image that does not contain a trail, it does not converge and therefore does not pass our validation algorithm. At this point of the process, Satmetrics would not continue onto the next step of measuring properties since there is no streak to measure.
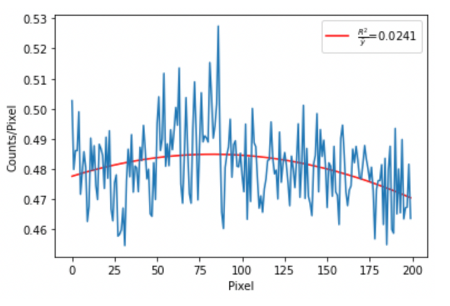 The image shows the median pixel intensity plot for an image where no actual streaks are present and we just detect noise