Motivation
Low Earth Orbit (LEO) satellites have played an integral role in society’s innovations and development by providing wireless communications and internet access. Yet despite their utility, the proliferation of these satellites pose a threat to the natural resource that is the sky. LEO satellites are highly reflective of the sun’s rays and orbit the Earth about every 90 minutes. As such, LEO satellites appear as bright, moving objects in the night sky to the unaided human eye. Because all kinds of sky observers from astronomers to animal species rely on an unobstructed view of the night sky for navigation, research, traditional practices, and more, these bright objects reduce the integrity of the night sky as an untampered resource. More concerningly, commercial aerospace engineering companies intend to launch LEO satellites at a hugely increasing rate each year for the foreseeable future. There are presently no regulations on how reflective these companies are expected to make the satellites they plan to launch or on how many they are allowed to launch.
This problem is especially pertinent for astronomers because LEO satellites impact telescope imaging. When telescopes capture images, they do so over the span of several seconds. Because LEO satellites are bright and rapidly moving, these satellites often appear as bright streaks in astronomical images, making astronomical research such as the discovery of new celestial bodies more difficult. And with the planned launch of more satellites, the incidence of these streaks in astronomical images will continue to grow. As of yet, there are few tools that allow astronomers to perform analyses on these streaks such as determining their width, their magnitudes (a standard astronomy unit for brightness), or their length.
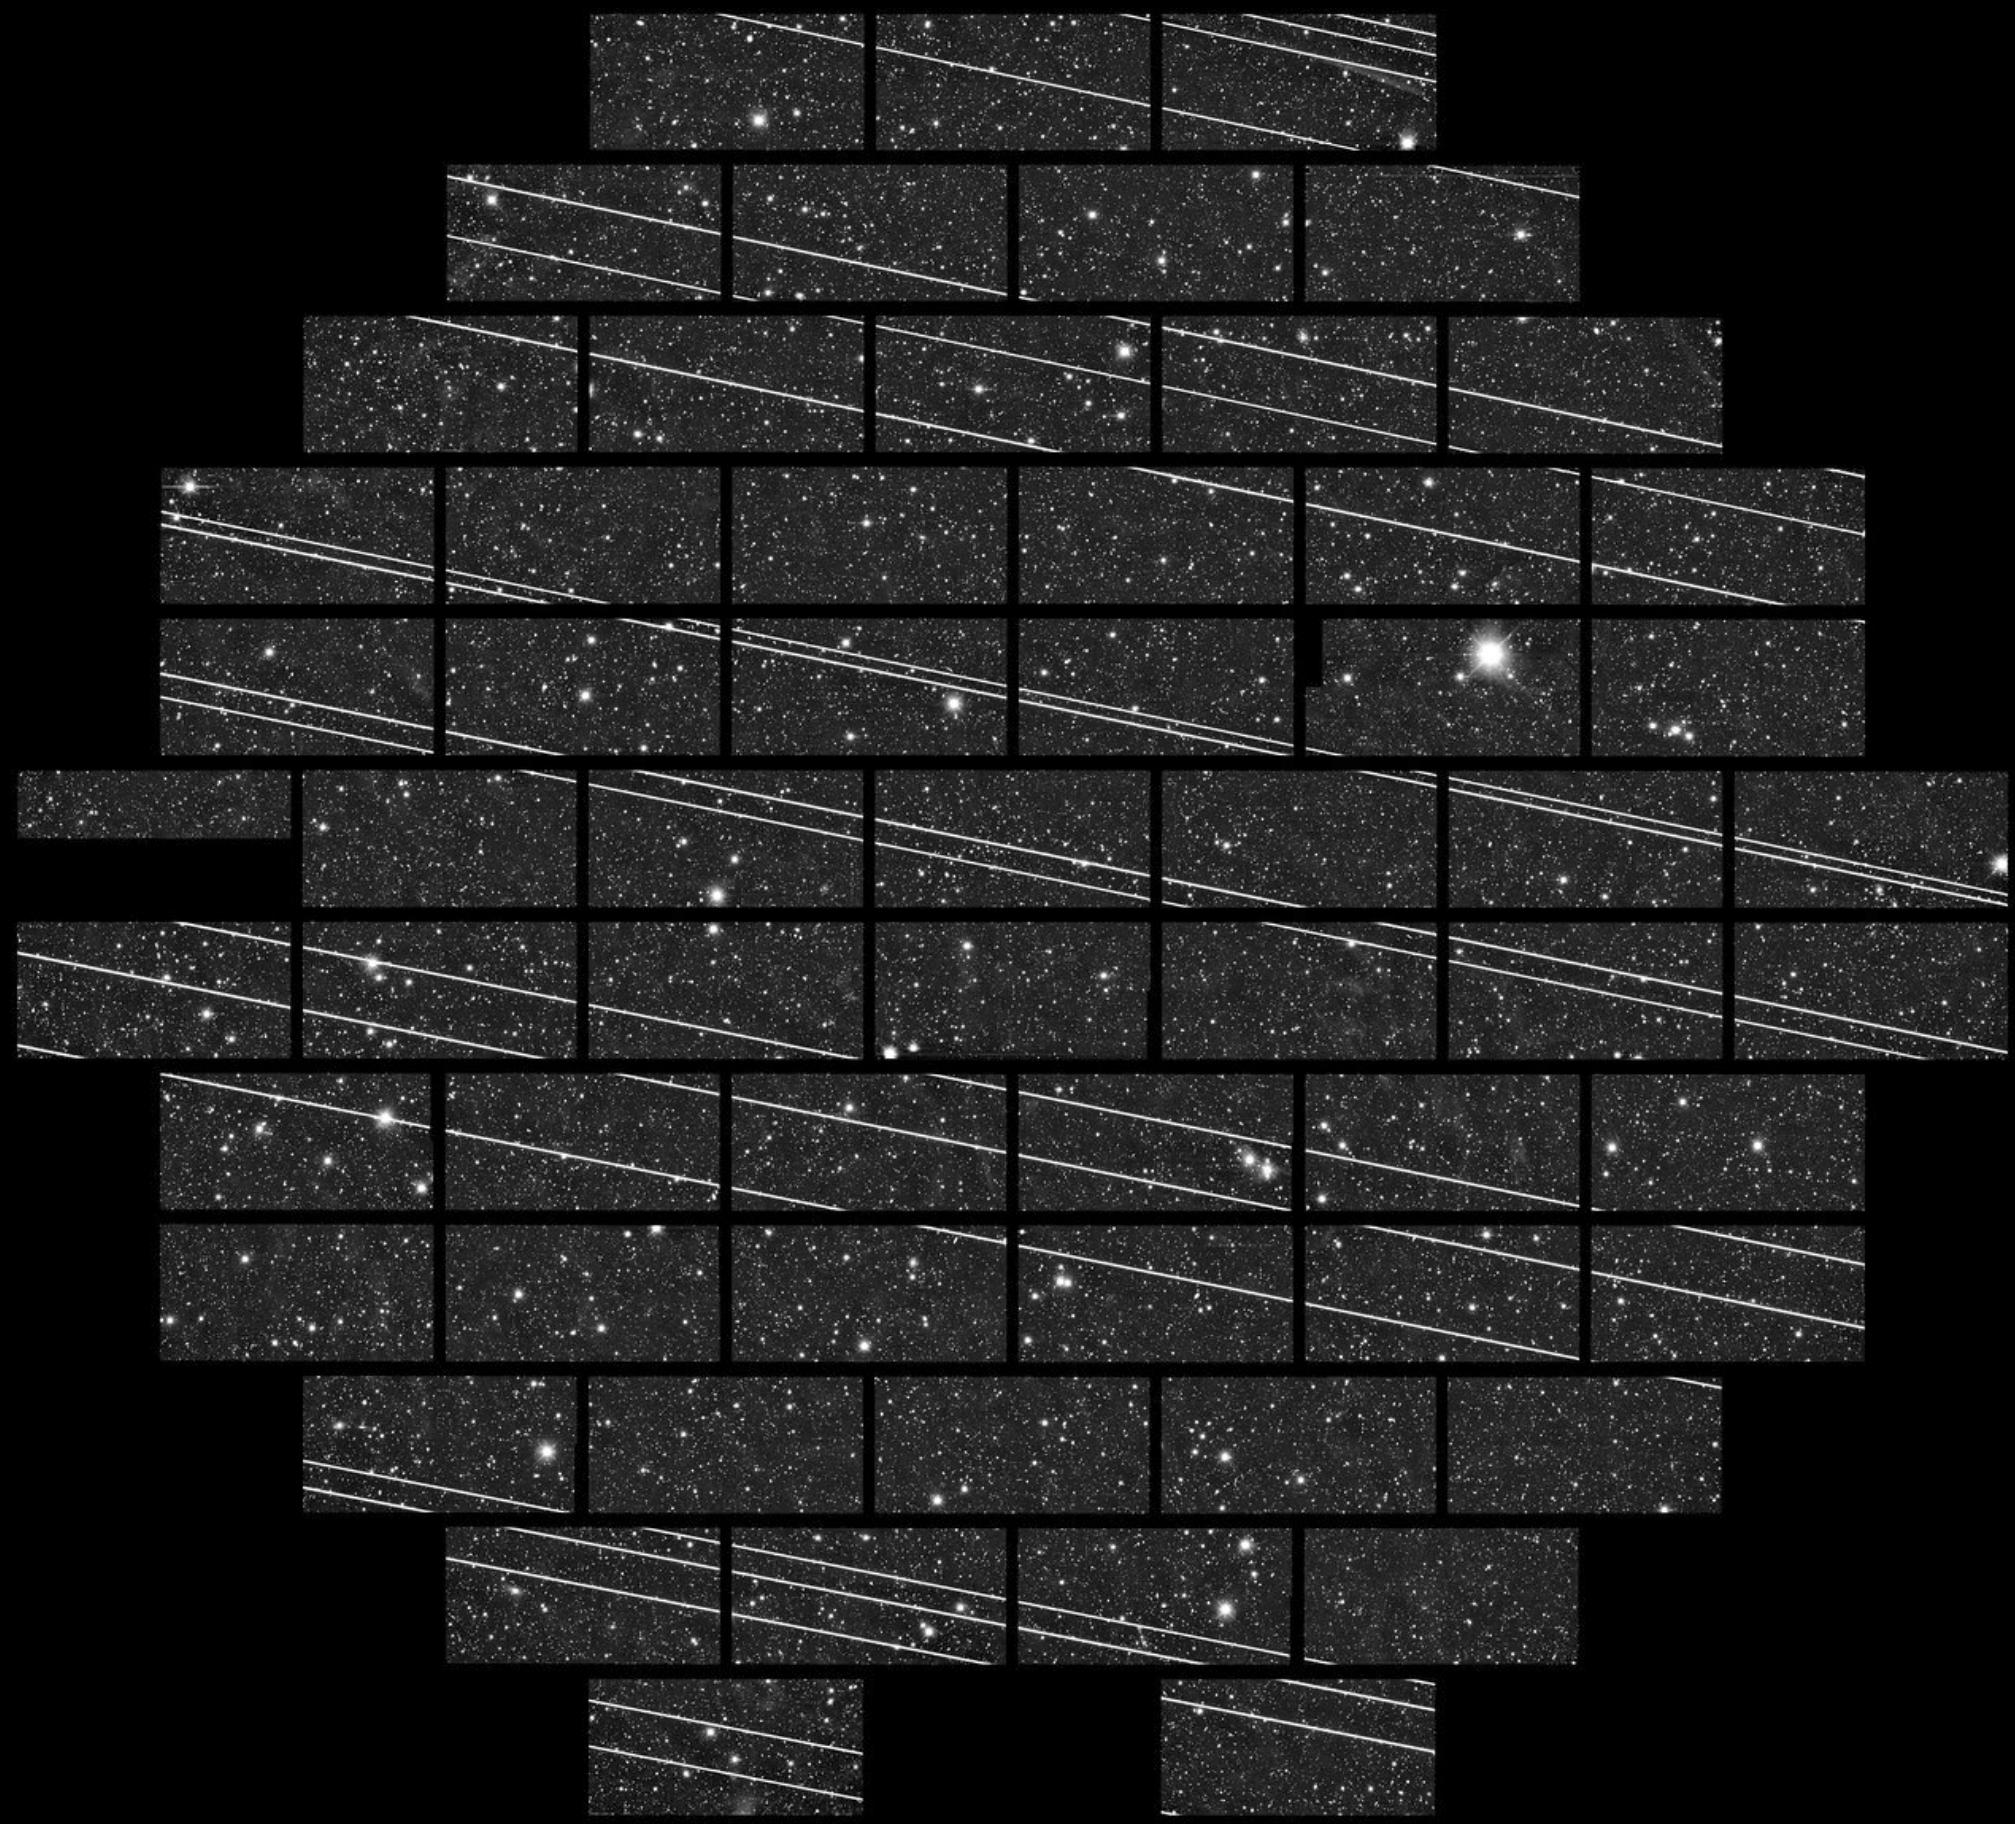 Example of an astronomical image affected by satellite streaks. Credits: Cerro Tololo Inter-American Observatory (CTIO)
Motivation/Goal
One of the first steps towards tackling this problem is quantifying its extent — how bright are the streaks, what is the extent of damage they cause to an image, and so on. Although some such analyses have been done in the past three years, there is no generalizable tool that can work on images with different properties originating from different telescopes. Hence, our goal is to move forward from bespoke and manually performed analyses to a more generically applicable method that is open source and does not rely on the specificities of particular images or telescopes. We aim to facilitate information generation about streaks that readily scales to enable useful analyses for astronomers and other users.
Output
The final output of this project is a Python library called Satmetrics. The library can take in any astronomical image in the form of a FITS (Flexible Image Transport System) file, detect the satellite streaks in it, and find basic properties of those streaks. A user can provide this library with multiple astronomical images as well as an optional dictionary of parameters that this library takes. Satmetrics then identifies possible streaks, validates them, and measures some of their properties. The properties measured are based on a best-fit Gaussian function:
- Mean brightness scaled to the pixel level of the image
- Amplitude, representing the height of the streak
- Width of the streak
If a streak is successfully validated, the library outputs a table of results for each detected streak, categorized by the file names and image in which it appears.
Satmetrics, in its current form, is intended primarily for astronomers, but is available to anyone who wishes to analyze properties of satellite streaks. Once a user receives these results, it could be used in many ways, for example:
- Measuring the streak brightness for a particular group of satellites (such as Starlink)
- Fact-checking the measured brightness against operator promised brightness
- Add additional information for each streak into the Trailblazer repository
Overall, we hope that the at-scale analyses of streaks facilitated by this tool generates information that can help draw more attention towards this problem and provide data for policy interventions in this space.
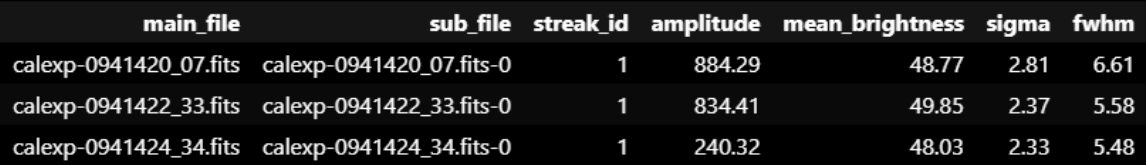 Example outputs of the satmetrics library