Respondent-Driven Sampling (RDS)
Respondent Driven Sampling (RDS) is a method both for data collection and statistical inference. The unit of analysis in RDS is a network structure rather than an individual, and the analysis generalizes to the networks of the sampled population. Unlike traditional sampling methods, this method of analysis influences the kind of estimators we use, the way we understand the variance around the estimates, and how we interpret the findings. Respondent-driven sampling (RDS) combined survey and statistical method for providing a quasi-probability sample for hard to reach populations such as people experiencing homelessness. The statistical model compensates for the fact that the sample was collected through peer referral rather than a traditional random sampling approach such as an addressed based sample. This method relies on multiple waves of peer-to-peer recruitment to approximate random sampling within “hard-to-reach” (see Figure 1). As a type of chain referral sampling, RDS is particularly useful when traditional probability sampling methods are not feasible (e.g., when a sampling frame does not exist). It integrates social network theory to reduce known biases such as oversampling people with large personal networks in the target population. RDS population estimates generalize to the target population (e.g., the population of people living unsheltered in King County).
RDS Assumptions
Theory supporting RDS requires:
- Respondents be selected from a social network of existing members of the target population
- Network degree (sometimes referred to, imprecisely, as their personal network, connectivity, or the number of connections or edges that ego (focal node) has to other nodes) is measured accurately
- The target population is well connected within their community.
RDS Estimator
Current estimators for RDS analysis are primarily developed to describe proportions in a network and make inference about an entire network based on information about the known part of the network (the part in your sample). For more details, see this article.
RDS-II Estimator (Volz & Heckathorn, 2008)
This method is based on inclusion probabilities for members of the sample and reported network sizes to adjust estimates. It allows for weights to be applied to the entire sample rather than to each variable separately. The approach models the sampling process as a first-order Markov random walk through the network of the target population, providing robust estimates by accounting for the complex social structures inherent in Respondent-Driven Sampling (RDS). This method approximates the population proportion by weighting it based on a repeated-sampling model for RDS, assuming that the inclusion probability is proportional to the degree of each respondent.
RDS Assumptions
1. Sampling Assumptions
- The seeds are chosen with probability proportional to their network degree.
- All respondents receive and use only one coupon.
- Each recruiter chooses their recruit at random from among their contacts.
- Sampling is performed with replacement.
2. Population/Network Assumptions
- Potential recruitment is symmetric (i.e., individual i would list individual j as a potential recruit if and only if j would list i).
- The network is connected such that there is a path from each individual to every other individual (i.e., the network is one connected component).
Under these assumptions, it is evident that at every step of the sampling process, each tie has an equal probability of being sampled. For more details, see this article.
Data Collection Process
IRB and Ethical Considerations
Before initiating the research, the research team secured approval from the University of Washington Institutional Review Board (IRB) for this study involving human subjects.
Seed Selection
Seed selection is a critical step in Respondent Driven Sampling (RDS) as it initiates the recruitment chain. For the 2023 UW King County Understanding Homelessness Project, the seed selection process was designed to ensure diversity and representation within the target population of individuals experiencing homelessness.
Criteria for Seed Selection
- Demographic Representation: Seeds were chosen to represent a range of demographic characteristics including age, gender, ethnicity, and homelessness status (e.g., sheltered vs. unsheltered).
- Network Size: Seeds were selected based on their personal network size within the target population. This ensured that they had sufficient connections to effectively initiate recruitment.
- Community Involvement: Individuals with established connections to local community organizations or networks were prioritized to enhance the reach and effectiveness of the recruitment process.
Recruitment of Seeds
Seeds were recruited through a combination of outreach efforts, including collaborations with local service providers, shelters, and community organizations. Potential seeds were approached with detailed information about the study and were selected based on their willingness to participate and their ability to recruit others.
Consent and Participation
Ensuring informed consent and maintaining participant confidentiality were paramount throughout the study.
Informed Consent
- Consent Form: Participants were provided with a consent form that detailed the study’s purpose, procedures, potential risks, and benefits. The form also outlined how their data would be used and assured them of confidentiality.
- Voluntary Participation: Participants were informed that their participation was voluntary and that they could withdraw at any time without any negative consequences.
Confidentiality
- Data Protection: Personal identifiers were removed from the dataset to maintain confidentiality. Unique identifiers were used to track responses while ensuring that individual identities were protected.
- Secure Storage: All data were stored in encrypted files and secured servers to prevent unauthorized access.
Survey Administration
- Survey Administration:
- Volunteers administered the survey using Qualtrics.
- Assistance was provided for participants with disabilities or language barriers.
- Proactive steps were taken to ensure accessibility, including guiding participants to suitable locations.
- Participants received verbal confirmation of successful submission and a thank-you message.
- Incentives:
- $20.00 gift card for completing the survey.
- Three QR coupon sheets for referrals.
- Additional $10 for participating in the PSD survey.
- $5 virtual gift card for each referral up to a maximum of $15.
- Two bus tickets for participants in hard-to-access locations.
Survey Duration and Locations
Data collection began in late April and concluded in early June, lasting just over a month. Volunteers and site managers were active at eleven distinct site locations.
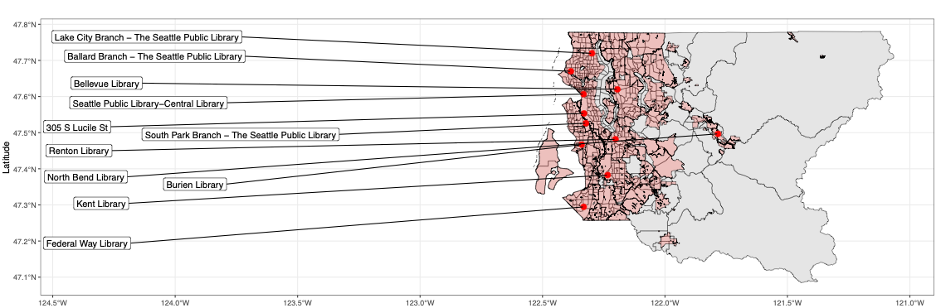 Figure 1: Recreated from Almquist et al. (in press). GIS representation of all 11 hub sites used in the survey with US Census urban areas in red and US Census tracts in gray.
Data Processing and Analysis
Data Cleaning
We prepared the data by creating functions to clean it and impute additional columns where needed. We shortened column names to enhance clarity and readability, such as using prefixes such as ego and alter and replacing terms like “household” with hr. These efforts resulted in a more streamlined and user-friendly dataset, facilitating accurate and efficient analysis. Additionally, we standardized common columns in both the RDS (Respondent-Driven Sampling) and PSD (Puget Sound Data) datasets to ensure consistency.
Data Analysis
RDS (version 0.9-9)
For the analysis, we utilized the RDS package (version 0.9-9), which provides various tools for implementing Respondent-Driven Sampling (RDS). The RDS package provides functionality for carrying out estimation with data collected using Respondent-Driven Sampling (RDS). It includes the Heckathorn’s RDS-I and RDS-II estimators as well as Gile’s Sequential Sampling estimator. This package is part of the “RDS Analyst” suite of packages designed for the analysis of respondent-driven sampling data.
The specific functions used in our analysis include:
-
bootstrap.contingency.test: This function performs a bootstrap test of independence between two categorical variables, offering a robust method for hypothesis testing, especially when sample sizes are small or distributions are unknown. -
RDS.II.estimates: This function computes RDS-II estimates for categorical or numeric variables, adjusting for network size and sample inclusion probabilities to provide accurate estimates.
For additional details, you can visit the RDS Package Documentation.
Data Weighting and Adjustment
To ensure that the results were representative of the target population, data weighting and adjustment were applied.
- Weight Calculation: Weights were calculated based on the number of recruits each participant was responsible for and the network size of the participants. This adjusted for any biases introduced by the non-random sampling process.
- Adjustments for Demographic Representation: Adjustments were made to account for discrepancies between the sample and the target population’s demographic distribution.
Statistical Analysis
Statistical analysis was performed to derive insights and draw conclusions from the data.
- Descriptive Statistics: Basic descriptive statistics, such as means, medians, proportions, and totals were calculated to summarize the data and provide an overview of the sample characteristics.
- Inferential Statistics: Advanced statistical techniques, including regression analysis and hypothesis testing, were used to make inferences about the larger population based on the sample data.
- RDS Analysis: RDS II estimators was employed to analyze the network data and adjust for the sampling design.
By accounting for varying probabilities of selection, RDS-II provides accurate percentage estimates within our survey data. For estimating the total number of unsheltered individuals, it allows us to estimate the population size accurately by correcting for biases and accounting for the network-based sampling method used in our survey. The RDS-II weight type adjusts for variations in network size and recruitment chains, ensuring that each individual’s contribution to the estimate reflects their true representation in the population. Additionally, the bootstrap.contingency.test function was used to draw bootstrap RDS samples from the population distribution and calculate the chi-squared statistic on the weighted contingency table, with weights calculated using the RDS-II estimator, providing a robust method for hypothesis testing.
Other Methods
- Weighted Bootstrap t-test
To analyze differences in a continuous variable between two groups, we utilized RDS estimation techniques to provide adjusted mean estimates and standard errors for each group. The RDS.II.estimates function was used to extract weighted mean estimates and their standard errors. We then conducted a Welch t-test to compare the means between the two groups, appropriate for cases with unequal variances. This method computed the t-statistic, degrees of freedom, p-value, and confidence intervals based on the weighted mean estimates and standard errors, offering a robust statistical comparison of the weighted means between the two groups.
Conclusion
This methods section outlines the critical components of the data collection, processing, and analysis methodologies employed in the 2023 UW King County Understanding Homelessness Project. The use of Respondent Driven Sampling (RDS) provides a robust framework for studying hard-to-reach populations, ensuring that the insights drawn from this research are both valid and reliable.
References
- Volz, E., & Heckathorn, D. D. (2008). Probability based estimation theory for respondent driven sampling. Journal of Official Statistics, 24(1), 79-97.
- Heckathorn, D. D. (1997). Respondent-driven sampling: a new approach to the study of hidden populations. Social Problems, 44(2), 174-199.