Veterans vs. Non-Veterans Codebook
Overview
This codebook summarizes findings and data about Veteran Status for Veterans and Non-Veterans based on data from the University of Washington (UW) 2023 Seattle area homeless count project. The count was led by Zack W. Almquist (Lead - PI), Paul Hebert (Co-PI), Nathalie Williams (Puget Sound Data Oversample PI), Amy Hagopian (Co-PI), June (Junhe) Yang (Data Scientist Lead DSSG PhD).
The data were collected using two different surveys, referred to as UWRDS and UWRDS-PSD in the codebook. Data from both surveys were harmonized for this codebook. We note where question phrasing differed across surveys and when a variable was collected in only one survey.
An HTML version of this anaylsis may be downloaded here.
This codebook and corresponding links were compiled by Data Science for Social Good (DSSG) summer fellows, in alphabetical order:
- Felix Junior Appiah Kubi,
- Brooke Kaye,
- Jess Robinson, and
- Rebecca Schachtman,
with the support of Data Scientist, June (Junhe) Yang, and Project Lead, Zack Almquist.
We employ RDS methods for the population level statistics (details, here). For information on funding and a full list of contributors, see Acknowledgements.
Summary
| Veteran Status | Sample N | Sample Proportion | RDS II Estimate | RDS II 95% CI |
|---|---|---|---|---|
| Non-Veterans | 972 | 90% | 89% | [86%, 92%] |
| Veterans | 111 | 10% | 11% | [8%, 14%] |
| Total | 1083 | 100% | 100% | - |
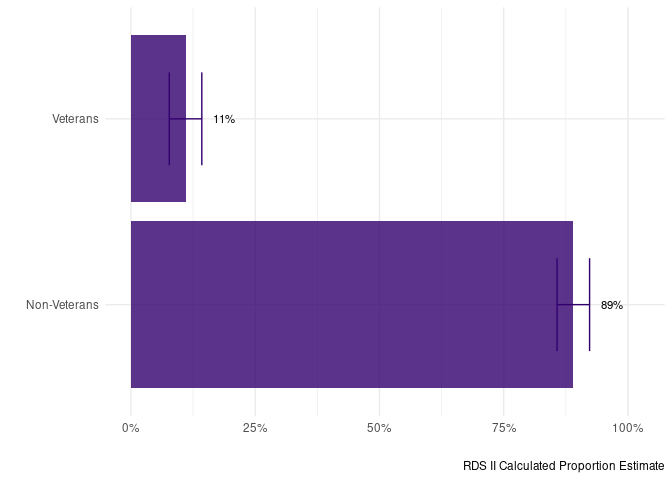
The proportion of the population experiencing homeless who are Veterans is 11%. The proportion of the population experiencing homeless who are Non-Veterans is 89%.
Demographics
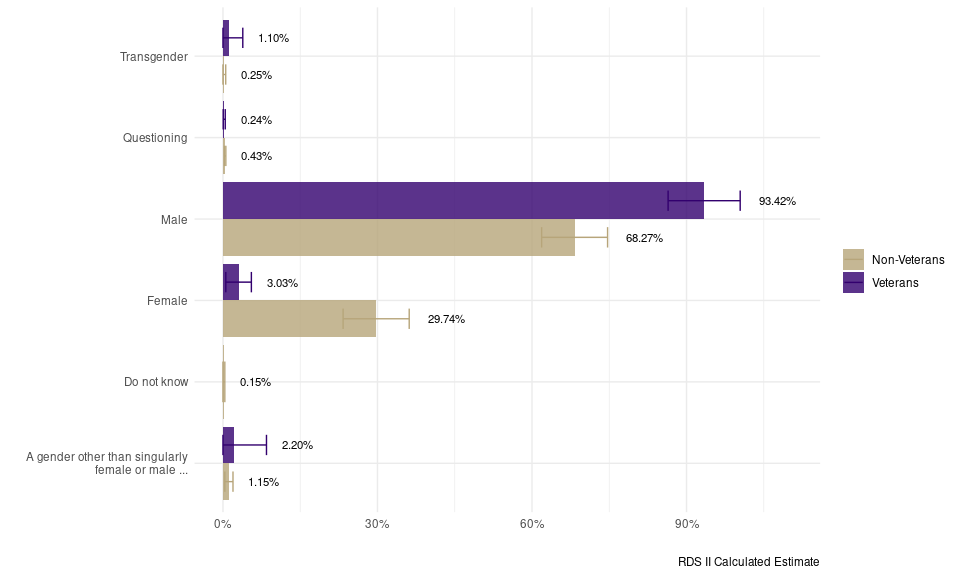
Gender
Imputed based on ‘B4. How would you describe your gender?’ [UWRDS-PSD] and ‘25. Which of the following best describes your gender?’ [UWRDS]
| Gender | Sample N | Sample Proportion | RDS II Estimate | RDS II 95% CI |
|---|---|---|---|---|
| A gender other than singularly female or male (e.g., nonbinary, genderfluid, agender, culturally specific gender) | 1 | 0.90% | 2.20% | [-4.05%, 8.45%] |
| Do not know | 0 | NA | NA | NA |
| Female | 6 | 5.41% | 3.03% | [0.55%, 5.51%] |
| Male | 102 | 91.89% | 93.42% | [86.43%, 100.42%] |
| Questioning | 1 | 0.90% | 0.24% | [0.05%, 0.44%] |
| Transgender | 1 | 0.90% | 1.10% | [-1.65%, 3.85%] |
| Total | 111 | - | - | - |
| Gender | Sample N | Sample Proportion | RDS II Estimate | RDS II 95% CI |
|---|---|---|---|---|
| A gender other than singularly female or male (e.g., nonbinary, genderfluid, agender, culturally specific gender) | 9 | 1.01% | 1.15% | [0.36%, 1.94%] |
| Do not know | 1 | 0.11% | 0.15% | [-0.06%, 0.36%] |
| Female | 269 | 30.06% | 29.74% | [23.33%, 36.16%] |
| Male | 610 | 68.16% | 68.27% | [61.87%, 74.67%] |
| Questioning | 4 | 0.45% | 0.43% | [0.30%, 0.56%] |
| Transgender | 2 | 0.22% | 0.25% | [-0.03%, 0.53%] |
| Total | 895 | - | - | - |
The difference between individual veterans and non-veterans is not significant, *χ2 = 40.52, (p = 0.277). These results were calculated based on the mean of 1000 bootstrapped tests. *
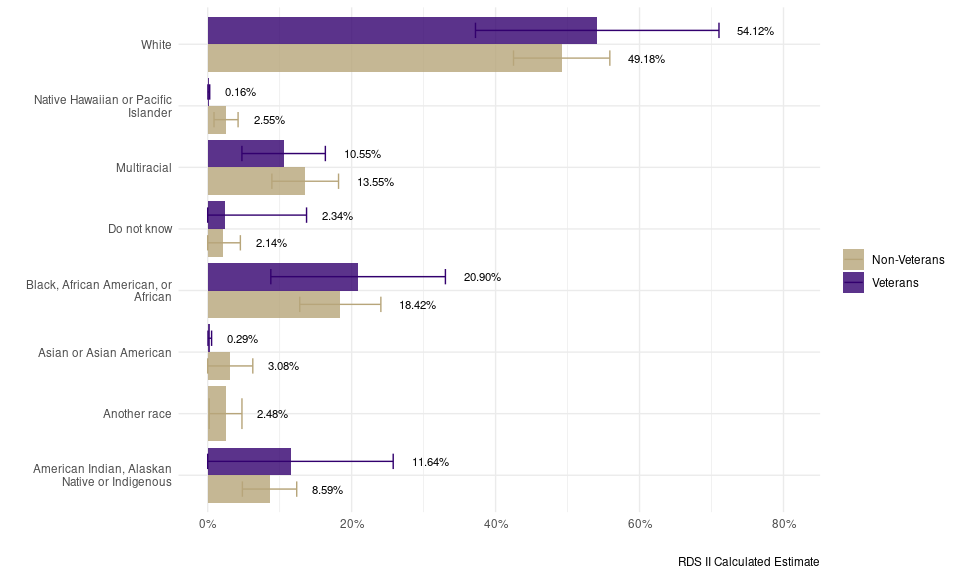
Race
Imputed based on ‘B18. Which one or more of the following would you say best describes your race, heritage, or ancestry?’ [UWRDS-PSD] and ‘23. Which racial groups do you identify with?’ [UWRDS]
Race (Overall)
| Race | Sample N | Sample Proportion | RDS II Estimate | RDS II 95% CI |
|---|---|---|---|---|
| American Indian, Alaskan Native or Indigenous | 8 | 7.62% | 11.64% | [-2.50%, 25.77%] |
| Another race | 0 | NA | NA | NA |
| Asian or Asian American | 1 | 0.95% | 0.29% | [0.04%, 0.54%] |
| Black, African American, or African | 23 | 21.90% | 20.90% | [8.77%, 33.03%] |
| Do not know | 1 | 0.95% | 2.34% | [-9.05%, 13.73%] |
| Multiracial | 12 | 11.43% | 10.55% | [4.75%, 16.35%] |
| Native Hawaiian or Pacific Islander | 1 | 0.95% | 0.16% | [0.03%, 0.28%] |
| White | 59 | 56.19% | 54.12% | [37.20%, 71.04%] |
| Total | 105 | - | - | - |
| Race | Sample N | Sample Proportion | RDS II Estimate | RDS II 95% CI |
|---|---|---|---|---|
| American Indian, Alaskan Native or Indigenous | 69 | 8.06% | 8.59% | [4.82%, 12.37%] |
| Another race | 14 | 1.64% | 2.48% | [0.20%, 4.76%] |
| Asian or Asian American | 19 | 2.22% | 3.08% | [-0.10%, 6.27%] |
| Black, African American, or African | 140 | 16.36% | 18.42% | [12.79%, 24.06%] |
| Do not know | 16 | 1.87% | 2.14% | [-0.26%, 4.54%] |
| Multiracial | 114 | 13.32% | 13.55% | [8.92%, 18.18%] |
| Native Hawaiian or Pacific Islander | 22 | 2.57% | 2.55% | [0.88%, 4.22%] |
| White | 462 | 53.97% | 49.18% | [42.49%, 55.87%] |
| Total | 856 | - | - | - |
The difference between individual veterans and non-veterans is not significant, *χ2 = 10.5, (p = 0.93). These results were calculated based on the mean of 1000 bootstrapped tests. This value was calculated with replacement.*
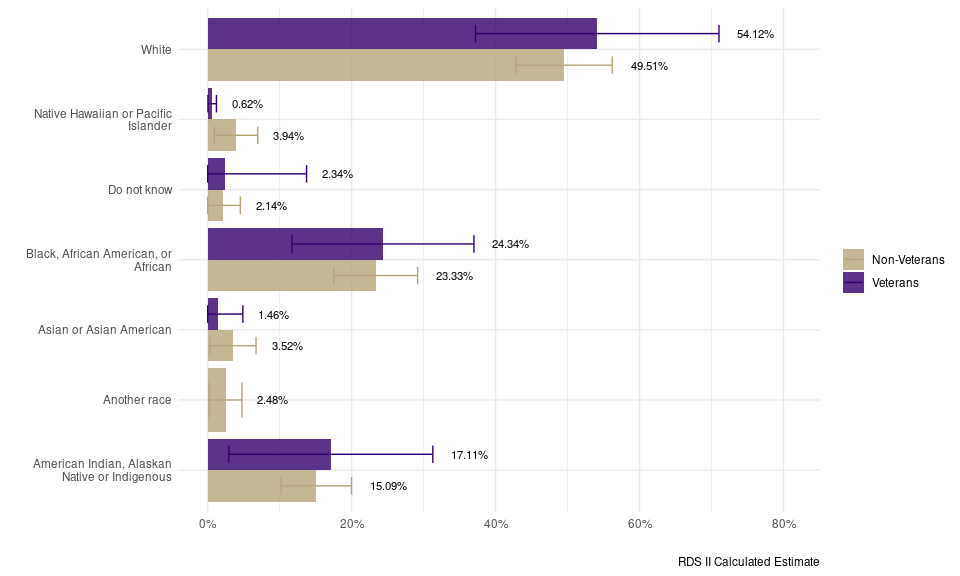
Race - Multiracial (Black)
Imputed racial category that classifies multiracial individuals as one race with preference to Black based on ‘23. Which racial groups do you identify with?’
| Race | Sample N | Sample Proportion | RDS II Estimate | RDS II 95% CI |
|---|---|---|---|---|
| American Indian, Alaskan Native or Indigenous | 12 | 11.43% | 17.11% | [2.94%, 31.27%] |
| Another race | 0 | NA | NA | NA |
| Asian or Asian American | 2 | 1.90% | 1.46% | [-1.96%, 4.88%] |
| Black, African American, or African | 29 | 27.62% | 24.34% | [11.69%, 36.99%] |
| Do not know | 1 | 0.95% | 2.34% | [-9.05%, 13.73%] |
| Native Hawaiian or Pacific Islander | 2 | 1.90% | 0.62% | [0.04%, 1.21%] |
| White | 59 | 56.19% | 54.12% | [37.20%, 71.04%] |
| Total | 105 | - | - | - |
| Race | Sample N | Sample Proportion | RDS II Estimate | RDS II 95% CI |
|---|---|---|---|---|
| American Indian, Alaskan Native or Indigenous | 124 | 14.49% | 15.09% | [10.19%, 19.98%] |
| Another race | 14 | 1.64% | 2.48% | [0.20%, 4.76%] |
| Asian or Asian American | 23 | 2.69% | 3.52% | [0.31%, 6.72%] |
| Black, African American, or African | 185 | 21.61% | 23.33% | [17.50%, 29.16%] |
| Do not know | 16 | 1.87% | 2.14% | [-0.26%, 4.54%] |
| Native Hawaiian or Pacific Islander | 29 | 3.39% | 3.94% | [0.93%, 6.94%] |
| White | 465 | 54.32% | 49.51% | [42.80%, 56.21%] |
| Total | 856 | - | - | - |
The difference between individual veterans and non-veterans is not significant, *χ2 = 7.78, (p = 0.973). These results were calculated based on the mean of 1000 bootstrapped tests. This value was calculated with replacement.*
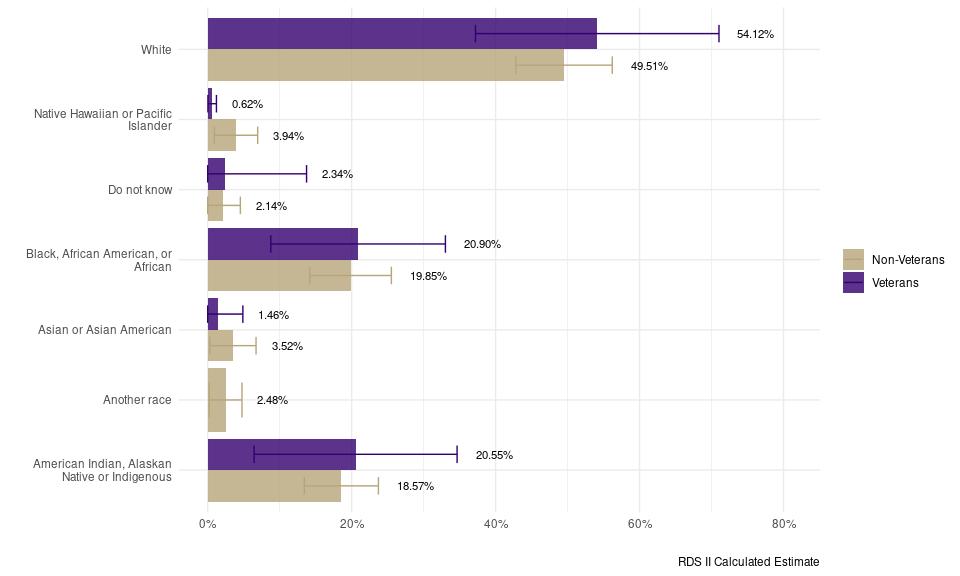
Race - Multiracial (Indigenous)
Imputed racial category that classifies multiracial individuals as one race with preference to Indigenous based on ‘23. Which racial groups do you identify with?’
| Race (Indigeneous) | Sample N | Sample Proportion | RDS II Estimate | RDS II 95% CI |
|---|---|---|---|---|
| American Indian, Alaskan Native or Indigenous | 18 | 17.14% | 20.55% | [6.45%, 34.65%] |
| Another race | 0 | NA | NA | NA |
| Asian or Asian American | 2 | 1.90% | 1.46% | [-1.96%, 4.88%] |
| Black, African American, or African | 23 | 21.90% | 20.90% | [8.77%, 33.03%] |
| Do not know | 1 | 0.95% | 2.34% | [-9.05%, 13.73%] |
| Native Hawaiian or Pacific Islander | 2 | 1.90% | 0.62% | [0.04%, 1.21%] |
| White | 59 | 56.19% | 54.12% | [37.20%, 71.04%] |
| Total | 105 | - | - | - |
| Race (Indigeneous) | Sample N | Sample Proportion | RDS II Estimate | RDS II 95% CI |
|---|---|---|---|---|
| American Indian, Alaskan Native or Indigenous | 156 | 18.22% | 18.57% | [13.43%, 23.72%] |
| Another race | 14 | 1.64% | 2.48% | [0.20%, 4.76%] |
| Asian or Asian American | 23 | 2.69% | 3.52% | [0.31%, 6.72%] |
| Black, African American, or African | 153 | 17.87% | 19.85% | [14.17%, 25.52%] |
| Do not know | 16 | 1.87% | 2.14% | [-0.26%, 4.54%] |
| Native Hawaiian or Pacific Islander | 29 | 3.39% | 3.94% | [0.93%, 6.94%] |
| White | 465 | 54.32% | 49.51% | [42.80%, 56.21%] |
| Total | 856 | - | - | - |
The difference between individual veterans and non-veterans is not significant, *χ2 = 7.74, (p = 0.957). These results were calculated based on the mean of 1000 bootstrapped tests. This value was calculated with replacement.*
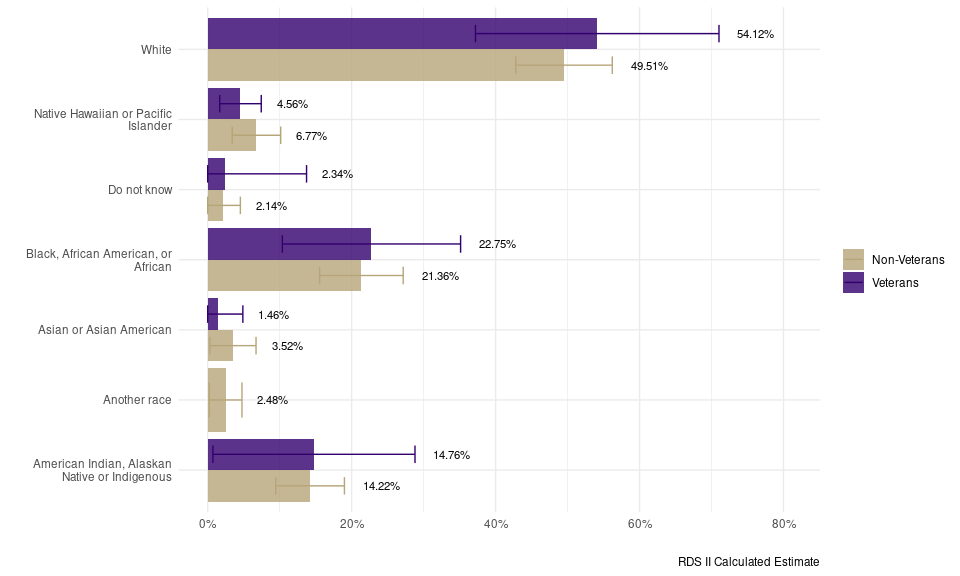
Race - Multiracial (Native Hawaiian or Pacific Islander)
Imputed racial category that classifies multiracial individuals as one race with preference to Native Hawaiian or Pacific Islander based on ‘23. Which racial groups do you identify with?’
| Race (PI) | Sample N | Sample Proportion | RDS II Estimate | RDS II 95% CI |
|---|---|---|---|---|
| American Indian, Alaskan Native or Indigenous | 11 | 10.48% | 14.76% | [0.72%, 28.80%] |
| Another race | 0 | NA | NA | NA |
| Asian or Asian American | 2 | 1.90% | 1.46% | [-1.96%, 4.88%] |
| Black, African American, or African | 26 | 24.76% | 22.75% | [10.37%, 35.14%] |
| Do not know | 1 | 0.95% | 2.34% | [-9.05%, 13.73%] |
| Native Hawaiian or Pacific Islander | 6 | 5.71% | 4.56% | [1.67%, 7.44%] |
| White | 59 | 56.19% | 54.12% | [37.20%, 71.04%] |
| Total | 105 | - | - | - |
| Race (PI) | Sample N | Sample Proportion | RDS II Estimate | RDS II 95% CI |
|---|---|---|---|---|
| American Indian, Alaskan Native or Indigenous | 118 | 13.79% | 14.22% | [9.45%, 19.00%] |
| Another race | 14 | 1.64% | 2.48% | [0.20%, 4.76%] |
| Asian or Asian American | 23 | 2.69% | 3.52% | [0.31%, 6.72%] |
| Black, African American, or African | 169 | 19.74% | 21.36% | [15.55%, 27.16%] |
| Do not know | 16 | 1.87% | 2.14% | [-0.26%, 4.54%] |
| Native Hawaiian or Pacific Islander | 51 | 5.96% | 6.77% | [3.41%, 10.14%] |
| White | 465 | 54.32% | 49.51% | [42.80%, 56.21%] |
| Total | 856 | - | - | - |
The difference between individual veterans and non-veterans is not significant, *χ2 = 5.3, (p = 0.955). These results were calculated based on the mean of 1000 bootstrapped tests. This value was calculated with replacement.*
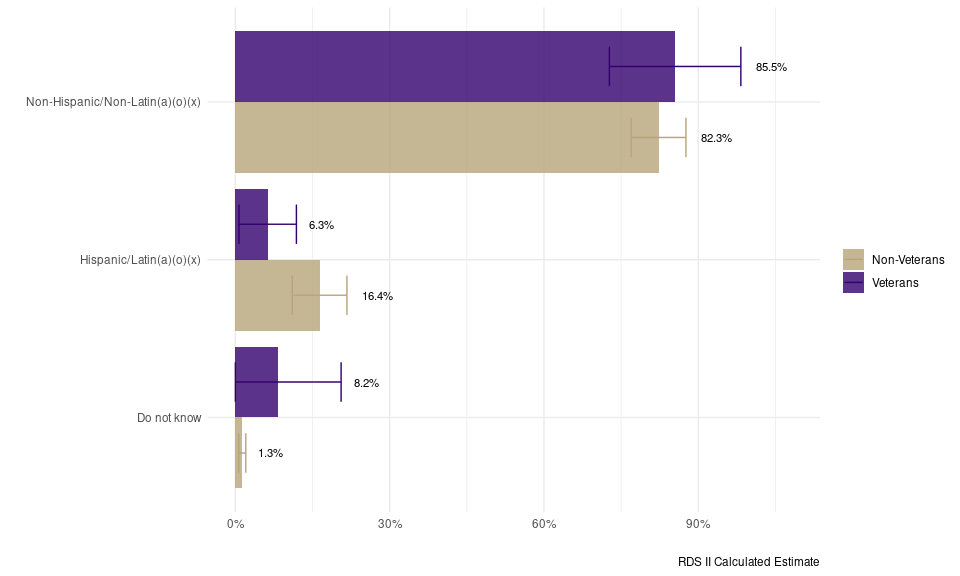
Ethnicity
Imputed based on ‘B16. Do you consider yourself Hispanic or Latinx’ [UWRDS-PSD] and ‘24. What is your ethnicity?’ [UWRDS]
| Ethnicity | Sample N | Sample Proportion | RDS II Estimate | RDS II 95% CI |
|---|---|---|---|---|
| Do not know | 5 | 4.7% | 8.2% | [-4.13%, 20.6%] |
| Hispanic/Latin(a)(o)(x) | 9 | 8.5% | 6.3% | [0.70%, 11.9%] |
| Non-Hispanic/Non-Latin(a)(o)(x) | 92 | 86.8% | 85.5% | [72.72%, 98.3%] |
| Total | 106 | - | - | - |
| Ethnicity | Sample N | Sample Proportion | RDS II Estimate | RDS II 95% CI |
|---|---|---|---|---|
| Do not know | 16 | 1.8% | 1.3% | [0.65%, 2.0%] |
| Hispanic/Latin(a)(o)(x) | 135 | 15.4% | 16.4% | [11.06%, 21.7%] |
| Non-Hispanic/Non-Latin(a)(o)(x) | 724 | 82.7% | 82.3% | [76.96%, 87.6%] |
| Total | 875 | - | - | - |
The difference between individual veterans and non-veterans is not significant, *χ2 = 28.65, (p = 0.255). These results were calculated based on the mean of 1000 bootstrapped tests. This value was calculated with replacement.*
Age
Date of Birth
Age (Categorical)
Imputed based on ‘A2. How old are you?’ [UWRDS-PSD] and ‘4. Date of Birth’ [UWRDS]
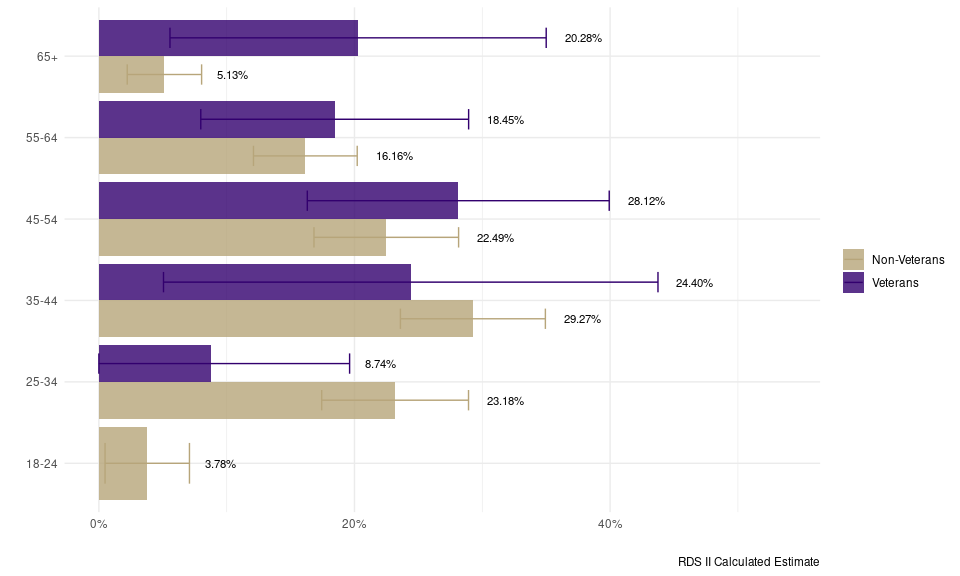
| Age Category | Sample N | Sample Proportion | RDS II Estimate | RDS II 95% CI |
|---|---|---|---|---|
| 18-24 | 0 | NA | NA | NA |
| 25-34 | 10 | 9.09% | 8.74% | [-2.13%, 19.620%] |
| 35-44 | 23 | 20.91% | 24.40% | [5.06%, 43.750%] |
| 45-54 | 31 | 28.18% | 28.12% | [16.31%, 39.930%] |
| 55-64 | 25 | 22.73% | 18.45% | [7.97%, 28.930%] |
| 65+ | 21 | 19.09% | 20.28% | [5.56%, 35.000%] |
| Total | 110 | - | - | - |
| Age Category | Sample N | Sample Proportion | RDS II Estimate | RDS II 95% CI |
|---|---|---|---|---|
| 18-24 | 25 | 2.79% | 3.78% | [0.48%, 7.090%] |
| 25-34 | 198 | 22.10% | 23.18% | [17.43%, 28.920%] |
| 35-44 | 275 | 30.69% | 29.27% | [23.59%, 34.940%] |
| 45-54 | 209 | 23.33% | 22.49% | [16.83%, 28.150%] |
| 55-64 | 149 | 16.63% | 16.16% | [12.10%, 20.210%] |
| 65+ | 40 | 4.46% | 5.13% | [2.22%, 8.040%] |
| Total | 896 | - | - | - |
The difference between individual veterans and non-veterans is significant at the .05 level, *χ2 = 51.43, (p = 0.039). These results were calculated based on the mean of 1000 bootstrapped tests. *
Age (Continuous)
Age - Imputed from ‘4. Date of Birth’
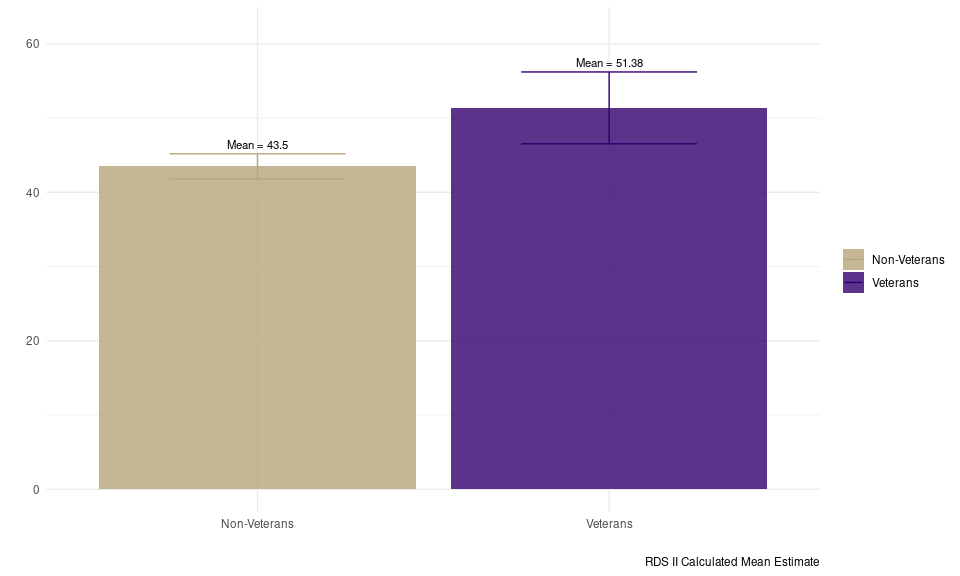
| Veteran Status | Sample N | Sample Median | Sample Mean | Sample SE | RDS II Estimate | RDS II 95% CI |
|---|---|---|---|---|---|---|
| Non-Veterans | 896 | 42 | 43.77 | 0.41 | 43.50 | [41.81, 45.18] |
| Veterans | 110 | 52 | 51.83 | 1.20 | 51.38 | [46.54, 56.22] |
The difference between individual veterans and non-veterans is significant at the .05 level, t(435.22) = 3.01, (p= 0.003).
Birthplace
Birth State
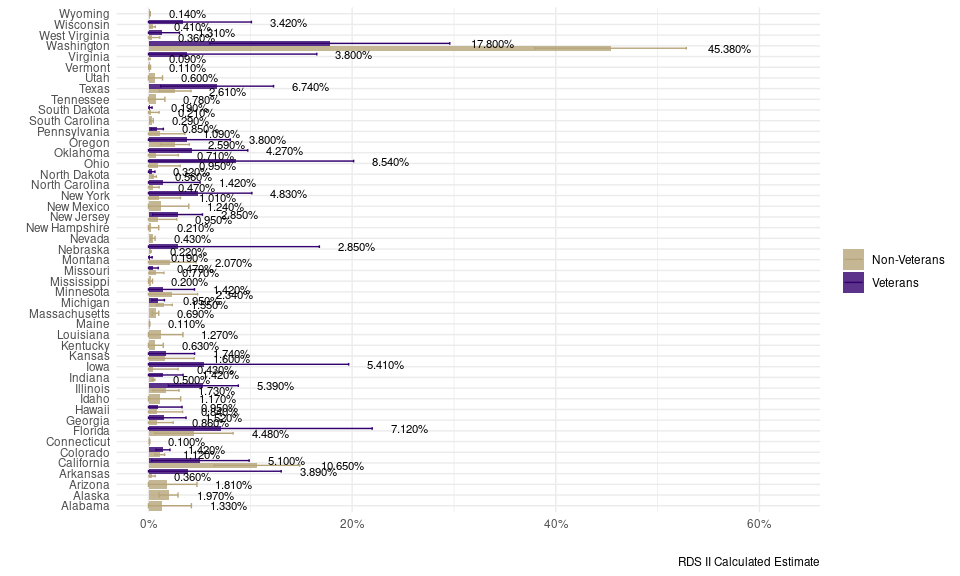
‘8. Birthplace: - State - In what city and state were you born? - Imputed’ This variable is not included for UWRDS-PSD survey observations.
| Birth State | Sample N | Sample Proportion | RDS II Estimate | RDS II 95% CI |
|---|---|---|---|---|
| Alabama | 0 | NA | NA | NA |
| Alaska | 0 | NA | NA | NA |
| Arizona | 0 | NA | NA | NA |
| Arkansas | 3 | 3.45% | 3.890% | [-5.24%, 13.030%] |
| California | 7 | 8.05% | 5.100% | [0.32%, 9.880%] |
| Colorado | 1 | 1.15% | 1.420% | [0.74%, 2.110%] |
| Connecticut | 0 | NA | NA | NA |
| Florida | 3 | 3.45% | 7.120% | [-7.73%, 21.970%] |
| Georgia | 2 | 2.30% | 1.520% | [-0.65%, 3.680%] |
| Hawaii | 1 | 1.15% | 0.950% | [-1.40%, 3.300%] |
| Idaho | 0 | NA | NA | NA |
| Illinois | 5 | 5.75% | 5.390% | [1.96%, 8.820%] |
| Indiana | 1 | 1.15% | 1.420% | [-0.54%, 3.390%] |
| Iowa | 4 | 4.60% | 5.410% | [-8.84%, 19.660%] |
| Kansas | 2 | 2.30% | 1.740% | [-1.05%, 4.530%] |
| Kentucky | 0 | NA | NA | NA |
| Louisiana | 0 | NA | NA | NA |
| Maine | 0 | NA | NA | NA |
| Massachusetts | 0 | NA | NA | NA |
| Michigan | 2 | 2.30% | 0.950% | [0.33%, 1.570%] |
| Minnesota | 1 | 1.15% | 1.420% | [-1.67%, 4.520%] |
| Mississippi | 0 | NA | NA | NA |
| Missouri | 1 | 1.15% | 0.470% | [0.00%, 0.950%] |
| Montana | 1 | 1.15% | 0.190% | [0.02%, 0.360%] |
| Nebraska | 1 | 1.15% | 2.850% | [-11.08%, 16.780%] |
| Nevada | 0 | NA | NA | NA |
| New Hampshire | 0 | NA | NA | NA |
| New Jersey | 1 | 1.15% | 2.850% | [0.40%, 5.300%] |
| New Mexico | 0 | NA | NA | NA |
| New York | 5 | 5.75% | 4.830% | [-0.50%, 10.150%] |
| North Carolina | 1 | 1.15% | 1.420% | [-2.22%, 5.070%] |
| North Dakota | 1 | 1.15% | 0.320% | [0.00%, 0.630%] |
| Ohio | 4 | 4.60% | 8.540% | [-3.06%, 20.150%] |
| Oklahoma | 2 | 2.30% | 4.270% | [-1.20%, 9.750%] |
| Oregon | 2 | 2.30% | 3.800% | [-0.44%, 8.030%] |
| Pennsylvania | 2 | 2.30% | 0.850% | [0.25%, 1.460%] |
| South Carolina | 0 | NA | NA | NA |
| South Dakota | 1 | 1.15% | 0.190% | [0.03%, 0.350%] |
| Tennessee | 0 | NA | NA | NA |
| Texas | 6 | 6.90% | 6.740% | [1.20%, 12.280%] |
| Utah | 0 | NA | NA | NA |
| Vermont | 0 | NA | NA | NA |
| Virginia | 2 | 2.30% | 3.800% | [-8.93%, 16.530%] |
| Washington | 21 | 24.14% | 17.800% | [6.02%, 29.590%] |
| West Virginia | 2 | 2.30% | 1.310% | [-0.43%, 3.040%] |
| Wisconsin | 2 | 2.30% | 3.420% | [-3.27%, 10.110%] |
| Wyoming | 0 | NA | NA | NA |
| Total | 87 | - | - | - |
| Birth State | Sample N | Sample Proportion | RDS II Estimate | RDS II 95% CI |
|---|---|---|---|---|
| Alabama | 6 | 0.88% | 1.330% | [-1.55%, 4.210%] |
| Alaska | 16 | 2.35% | 1.970% | [1.05%, 2.900%] |
| Arizona | 8 | 1.18% | 1.810% | [-1.13%, 4.760%] |
| Arkansas | 2 | 0.29% | 0.360% | [0.06%, 0.660%] |
| California | 78 | 11.47% | 10.650% | [6.45%, 14.860%] |
| Colorado | 11 | 1.62% | 1.120% | [0.65%, 1.580%] |
| Connecticut | 2 | 0.29% | 0.100% | [0.07%, 0.130%] |
| Florida | 22 | 3.24% | 4.480% | [0.65%, 8.310%] |
| Georgia | 3 | 0.44% | 0.860% | [-0.70%, 2.420%] |
| Hawaii | 4 | 0.59% | 0.840% | [-1.67%, 3.350%] |
| Idaho | 6 | 0.88% | 1.170% | [-0.81%, 3.150%] |
| Illinois | 10 | 1.47% | 1.730% | [0.46%, 3.000%] |
| Indiana | 3 | 0.44% | 0.500% | [0.38%, 0.620%] |
| Iowa | 1 | 0.15% | 0.430% | [-2.05%, 2.900%] |
| Kansas | 8 | 1.18% | 1.600% | [-1.27%, 4.470%] |
| Kentucky | 6 | 0.88% | 0.630% | [-0.18%, 1.450%] |
| Louisiana | 8 | 1.18% | 1.270% | [-0.83%, 3.380%] |
| Maine | 1 | 0.15% | 0.110% | [0.08%, 0.130%] |
| Massachusetts | 4 | 0.59% | 0.690% | [0.37%, 1.010%] |
| Michigan | 11 | 1.62% | 1.550% | [0.78%, 2.330%] |
| Minnesota | 9 | 1.32% | 2.340% | [-0.15%, 4.820%] |
| Mississippi | 2 | 0.29% | 0.200% | [0.00%, 0.390%] |
| Missouri | 7 | 1.03% | 0.770% | [0.04%, 1.510%] |
| Montana | 16 | 2.35% | 2.070% | [-0.53%, 4.680%] |
| Nebraska | 3 | 0.44% | 0.220% | [0.16%, 0.270%] |
| Nevada | 1 | 0.15% | 0.430% | [0.21%, 0.650%] |
| New Hampshire | 1 | 0.15% | 0.210% | [-0.57%, 1.000%] |
| New Jersey | 7 | 1.03% | 0.950% | [-0.87%, 2.780%] |
| New Mexico | 7 | 1.03% | 1.240% | [-1.47%, 3.950%] |
| New York | 6 | 0.88% | 1.010% | [-1.13%, 3.140%] |
| North Carolina | 3 | 0.44% | 0.470% | [-0.12%, 1.050%] |
| North Dakota | 4 | 0.59% | 0.560% | [0.35%, 0.770%] |
| Ohio | 6 | 0.88% | 0.950% | [-1.21%, 3.110%] |
| Oklahoma | 5 | 0.74% | 0.710% | [-1.51%, 2.930%] |
| Oregon | 18 | 2.65% | 2.590% | [1.17%, 4.010%] |
| Pennsylvania | 6 | 0.88% | 1.090% | [-1.39%, 3.570%] |
| South Carolina | 4 | 0.59% | 0.290% | [0.13%, 0.460%] |
| South Dakota | 1 | 0.15% | 0.210% | [-0.62%, 1.050%] |
| Tennessee | 9 | 1.32% | 0.780% | [-0.05%, 1.610%] |
| Texas | 15 | 2.21% | 2.610% | [1.05%, 4.170%] |
| Utah | 4 | 0.59% | 0.600% | [-0.17%, 1.380%] |
| Vermont | 1 | 0.15% | 0.110% | [0.02%, 0.200%] |
| Virginia | 1 | 0.15% | 0.090% | [0.01%, 0.160%] |
| Washington | 328 | 48.24% | 45.380% | [37.93%, 52.820%] |
| West Virginia | 2 | 0.29% | 0.360% | [-0.39%, 1.110%] |
| Wisconsin | 3 | 0.44% | 0.410% | [0.15%, 0.670%] |
| Wyoming | 1 | 0.15% | 0.140% | [0.11%, 0.180%] |
| Total | 680 | - | - | - |
The difference between individual veterans and non-veterans is not significant, *χ2 = 156.42, (p = 0.996). These results were calculated based on the mean of 1000 bootstrapped tests. *
Birth Country
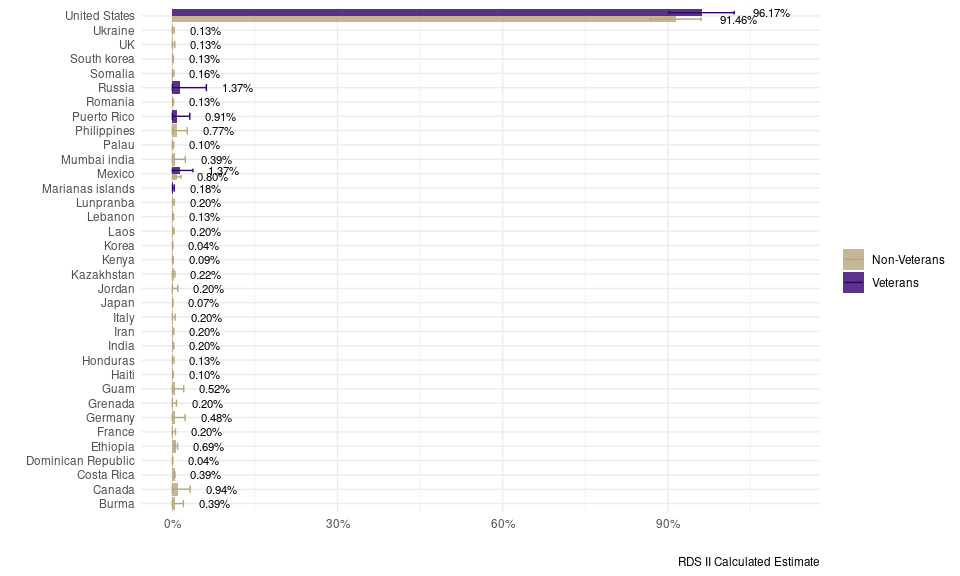
‘8. Birthplace: - Country - In what city and state were you born? - Imputed’ This variable is not included for UWRDS-PSD survey observations.
| Birth Country | Sample N | Sample Proportion | RDS II Estimate | RDS II 95% CI |
|---|---|---|---|---|
| Burma | 0 | NA | NA | NA |
| Canada | 0 | NA | NA | NA |
| Costa Rica | 0 | NA | NA | NA |
| Dominican Republic | 0 | NA | NA | NA |
| Ethiopia | 0 | NA | NA | NA |
| France | 0 | NA | NA | NA |
| Germany | 0 | NA | NA | NA |
| Grenada | 0 | NA | NA | NA |
| Guam | 0 | NA | NA | NA |
| Haiti | 0 | NA | NA | NA |
| Honduras | 0 | NA | NA | NA |
| India | 0 | NA | NA | NA |
| Iran | 0 | NA | NA | NA |
| Italy | 0 | NA | NA | NA |
| Japan | 0 | NA | NA | NA |
| Jordan | 0 | NA | NA | NA |
| Kazakhstan | 0 | NA | NA | NA |
| Kenya | 0 | NA | NA | NA |
| Korea | 0 | NA | NA | NA |
| Laos | 0 | NA | NA | NA |
| Lebanon | 0 | NA | NA | NA |
| Lunpranba | 0 | NA | NA | NA |
| Mexico | 1 | 1.10% | 1.37% | [-0.99%, 3.730%] |
| Mumbai india | 0 | NA | NA | NA |
| Palau | 0 | NA | NA | NA |
| Philippines | 0 | NA | NA | NA |
| Romania | 0 | NA | NA | NA |
| Somalia | 0 | NA | NA | NA |
| South korea | 0 | NA | NA | NA |
| UK | 0 | NA | NA | NA |
| Ukraine | 0 | NA | NA | NA |
| United States | 87 | 95.60% | 96.17% | [90.25%, 102.080%] |
| Marianas islands | 1 | 1.10% | 0.18% | [0.03%, 0.340%] |
| Puerto Rico | 1 | 1.10% | 0.91% | [-1.34%, 3.170%] |
| Russia | 1 | 1.10% | 1.37% | [-3.44%, 6.180%] |
| Total | 91 | - | - | - |
| Birth Country | Sample N | Sample Proportion | RDS II Estimate | RDS II 95% CI |
|---|---|---|---|---|
| Burma | 1 | 0.14% | 0.39% | [-1.22%, 2.000%] |
| Canada | 4 | 0.55% | 0.94% | [-1.34%, 3.230%] |
| Costa Rica | 1 | 0.14% | 0.39% | [0.32%, 0.470%] |
| Dominican Republic | 1 | 0.14% | 0.04% | [0.02%, 0.060%] |
| Ethiopia | 3 | 0.41% | 0.69% | [0.42%, 0.950%] |
| France | 1 | 0.14% | 0.20% | [-0.17%, 0.560%] |
| Germany | 3 | 0.41% | 0.48% | [-1.35%, 2.310%] |
| Grenada | 1 | 0.14% | 0.20% | [-0.34%, 0.730%] |
| Guam | 2 | 0.27% | 0.52% | [-1.01%, 2.060%] |
| Haiti | 1 | 0.14% | 0.10% | [0.07%, 0.130%] |
| Honduras | 1 | 0.14% | 0.13% | [-0.02%, 0.280%] |
| India | 2 | 0.27% | 0.20% | [0.14%, 0.250%] |
| Iran | 1 | 0.14% | 0.20% | [0.15%, 0.240%] |
| Italy | 1 | 0.14% | 0.20% | [-0.12%, 0.510%] |
| Japan | 1 | 0.14% | 0.07% | [0.04%, 0.090%] |
| Jordan | 1 | 0.14% | 0.20% | [-0.59%, 0.980%] |
| Kazakhstan | 2 | 0.27% | 0.22% | [-0.02%, 0.460%] |
| Kenya | 2 | 0.27% | 0.09% | [0.02%, 0.160%] |
| Korea | 1 | 0.14% | 0.04% | [0.01%, 0.070%] |
| Laos | 1 | 0.14% | 0.20% | [0.09%, 0.300%] |
| Lebanon | 1 | 0.14% | 0.13% | [0.04%, 0.220%] |
| Lunpranba | 1 | 0.14% | 0.20% | [0.04%, 0.350%] |
| Mexico | 4 | 0.55% | 0.80% | [0.01%, 1.580%] |
| Mumbai india | 1 | 0.14% | 0.39% | [-1.57%, 2.350%] |
| Palau | 1 | 0.14% | 0.10% | [-0.03%, 0.230%] |
| Philippines | 4 | 0.55% | 0.77% | [-1.16%, 2.690%] |
| Romania | 1 | 0.14% | 0.13% | [0.06%, 0.200%] |
| Somalia | 2 | 0.27% | 0.16% | [0.03%, 0.280%] |
| South korea | 1 | 0.14% | 0.13% | [0.09%, 0.170%] |
| UK | 1 | 0.14% | 0.13% | [-0.17%, 0.430%] |
| Ukraine | 1 | 0.14% | 0.13% | [-0.06%, 0.320%] |
| United States | 682 | 93.30% | 91.46% | [86.87%, 96.050%] |
| Marianas islands | 0 | NA | NA | NA |
| Puerto Rico | 0 | NA | NA | NA |
| Russia | 0 | NA | NA | NA |
| Total | 731 | - | - | - |
The difference between individual veterans and non-veterans is not significant, *χ2 = 24.25, (p = 1). These results were calculated based on the mean of 1000 bootstrapped tests. *
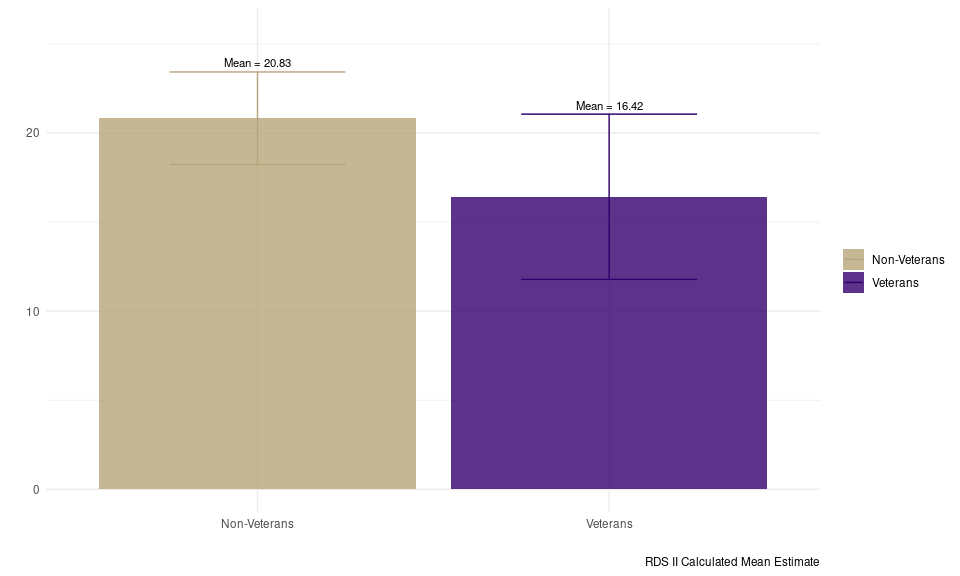
Years Lived in King County
‘9. How long have you lived in King County? - Imputed’ This variable is not included for UWRDS-PSD survey observations.
| Veteran Status | Sample N | Sample Median | Sample Mean | Sample SE | RDS II Estimate | RDS II 95% CI |
|---|---|---|---|---|---|---|
| Non-Veterans | 749 | 20 | 21.75 | 0.64 | 20.83 | [18.23, 23.42] |
| Veterans | 95 | 15 | 19.72 | 1.79 | 16.42 | [11.78, 21.06] |
The difference between individual veterans and non-veterans is not significant, t(371.42) = -1.63, (p= 0.105).
Health
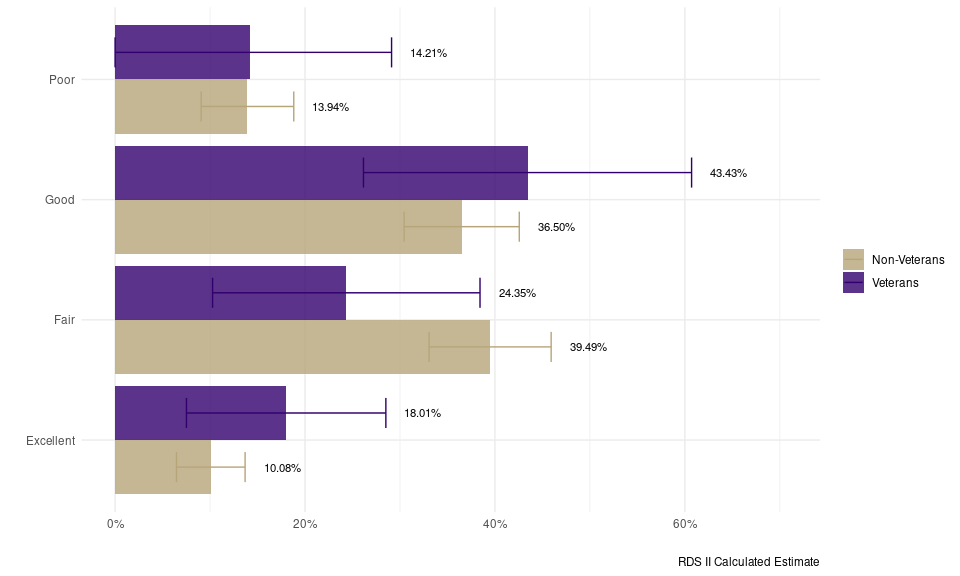
Health Status
Imputed based on ‘D1. In general, would you say your health is’ [UWRDS-PSD] and ‘16. How would you rate your health status?’ [UWRDS]
| Ego Health Status | Sample N | Sample Proportion | RDS II Estimate | RDS II 95% CI |
|---|---|---|---|---|
| Excellent | 16 | 14.41% | 18.01% | [7.5%, 28.51%] |
| Fair | 33 | 29.73% | 24.35% | [10.3%, 38.43%] |
| Good | 49 | 44.14% | 43.43% | [26.2%, 60.71%] |
| Poor | 13 | 11.71% | 14.21% | [-0.7%, 29.11%] |
| Total | 111 | - | - | - |
| Ego Health Status | Sample N | Sample Proportion | RDS II Estimate | RDS II 95% CI |
|---|---|---|---|---|
| Excellent | 85 | 9.50% | 10.08% | [6.5%, 13.69%] |
| Fair | 352 | 39.33% | 39.49% | [33.1%, 45.92%] |
| Good | 344 | 38.44% | 36.50% | [30.4%, 42.56%] |
| Poor | 114 | 12.74% | 13.94% | [9.1%, 18.81%] |
| Total | 895 | - | - | - |
The difference between individual veterans and non-veterans is not significant, *χ2 = 13.64, (p = 0.452). These results were calculated based on the mean of 1000 bootstrapped tests. This value was calculated with replacement.*
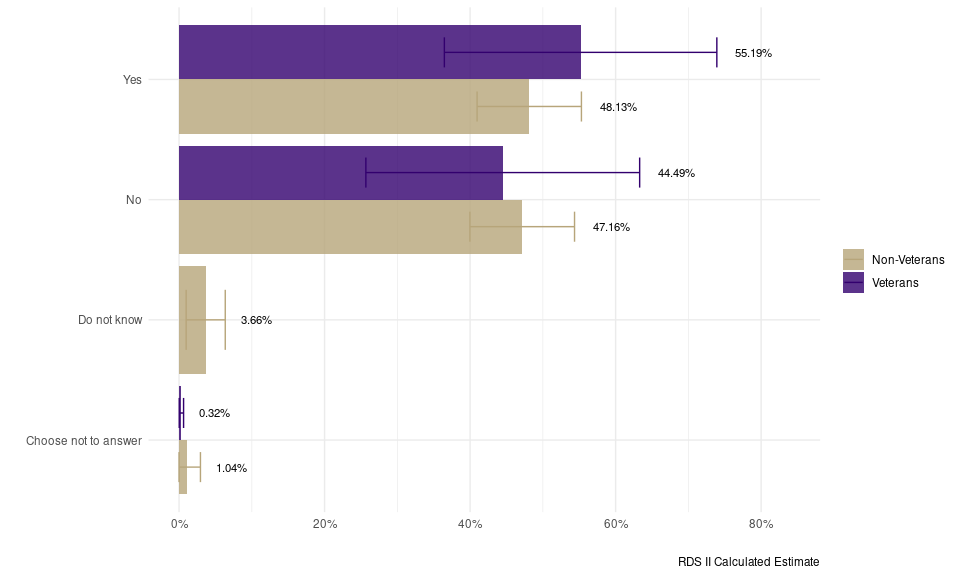
Disability
‘21. Do you identify as having a disability?’ This variable is not included for UWRDS-PSD survey observations.
| Have a Disability | Sample N | Sample Proportion | RDS II Estimate | RDS II 95% CI |
|---|---|---|---|---|
| Choose not to answer | 1 | 1.05% | 0.32% | [0.03%, 0.62%] |
| Do not know | 0 | NA | NA | NA |
| No | 37 | 38.95% | 44.49% | [25.67%, 63.30%] |
| Yes | 57 | 60.00% | 55.19% | [36.46%, 73.91%] |
| Total | 95 | - | - | - |
| Have a Disability | Sample N | Sample Proportion | RDS II Estimate | RDS II 95% CI |
|---|---|---|---|---|
| Choose not to answer | 5 | 0.67% | 1.04% | [-0.85%, 2.94%] |
| Do not know | 22 | 2.93% | 3.66% | [0.98%, 6.35%] |
| No | 340 | 45.33% | 47.16% | [39.97%, 54.35%] |
| Yes | 383 | 51.07% | 48.13% | [40.96%, 55.30%] |
| Total | 750 | - | - | - |
The difference between individual veterans and non-veterans is not significant, *χ2 = 5.19, (p = 0.764). These results were calculated based on the mean of 1000 bootstrapped tests. This value was calculated with replacement.*
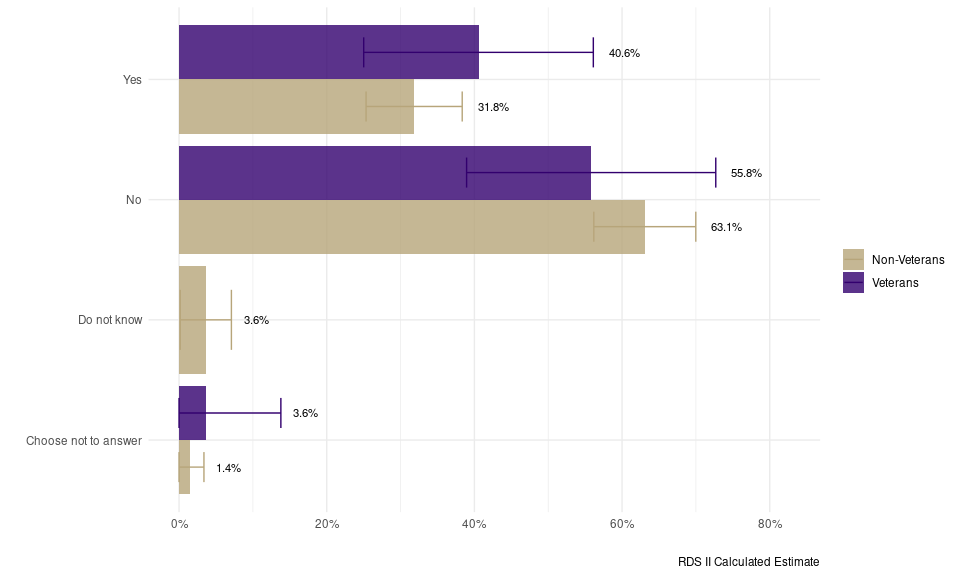
Mental Illness
‘20. Do you identify as having a serious mental illness?’ This variable is not included for UWRDS-PSD survey observations.
| Have a Mental Illness | Sample N | Sample Proportion | RDS II Estimate | RDS II 95% CI |
|---|---|---|---|---|
| Choose not to answer | 3 | 3.16% | 3.6% | [-6.54%, 13.8%] |
| Do not know | 0 | NA | NA | NA |
| No | 52 | 54.74% | 55.8% | [38.94%, 72.7%] |
| Yes | 40 | 42.11% | 40.6% | [25.01%, 56.1%] |
| Total | 95 | - | - | - |
| Have a Mental Illness | Sample N | Sample Proportion | RDS II Estimate | RDS II 95% CI |
|---|---|---|---|---|
| Choose not to answer | 7 | 0.93% | 1.4% | [-0.46%, 3.4%] |
| Do not know | 23 | 3.06% | 3.6% | [0.16%, 7.1%] |
| No | 452 | 60.19% | 63.1% | [56.18%, 70.0%] |
| Yes | 269 | 35.82% | 31.8% | [25.33%, 38.4%] |
| Total | 751 | - | - | - |
The difference between individual veterans and non-veterans is not significant, *χ2 = 8.8, (p = 0.159). These results were calculated based on the mean of 1000 bootstrapped tests. This value was calculated with replacement.*
Substance Use
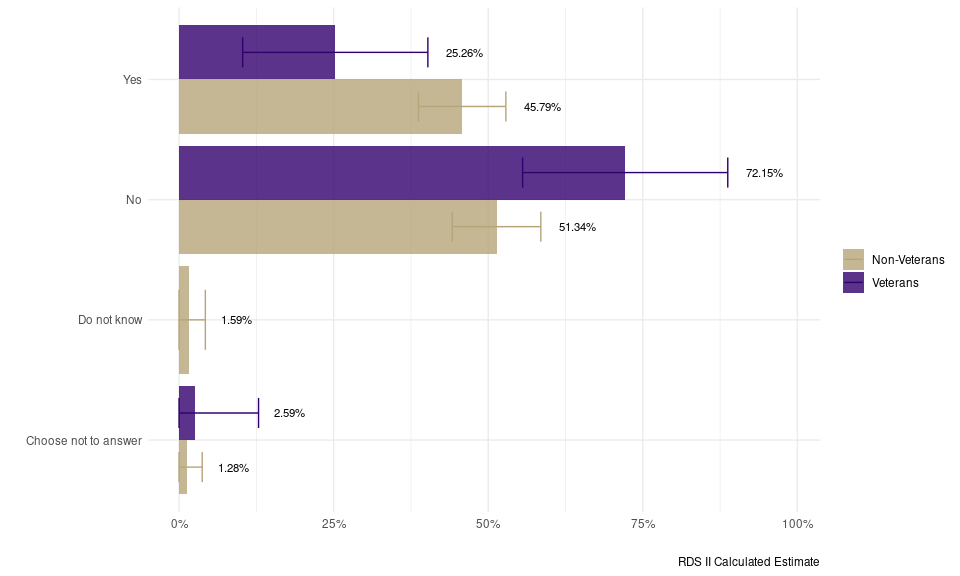
‘22. Do you identify as having a substance use disorder?’ This variable is not included for UWRDS-PSD survey observations.
| Have a Substance Use Disorder | Sample N | Sample Proportion | RDS II Estimate | RDS II 95% CI |
|---|---|---|---|---|
| Choose not to answer | 1 | 1.05% | 2.59% | [-7.68%, 12.86%] |
| Do not know | 0 | NA | NA | NA |
| No | 62 | 65.26% | 72.15% | [55.56%, 88.74%] |
| Yes | 32 | 33.68% | 25.26% | [10.28%, 40.24%] |
| Total | 95 | - | - | - |
| Have a Substance Use Disorder | Sample N | Sample Proportion | RDS II Estimate | RDS II 95% CI |
|---|---|---|---|---|
| Choose not to answer | 7 | 0.93% | 1.28% | [-1.19%, 3.75%] |
| Do not know | 7 | 0.93% | 1.59% | [-1.07%, 4.25%] |
| No | 363 | 48.40% | 51.34% | [44.19%, 58.50%] |
| Yes | 373 | 49.73% | 45.79% | [38.72%, 52.85%] |
| Total | 750 | - | - | - |
The difference between individual veterans and non-veterans is not significant, *χ2 = 18.23, (p = 0.269). These results were calculated based on the mean of 1000 bootstrapped tests. This value was calculated with replacement.*
Eviction
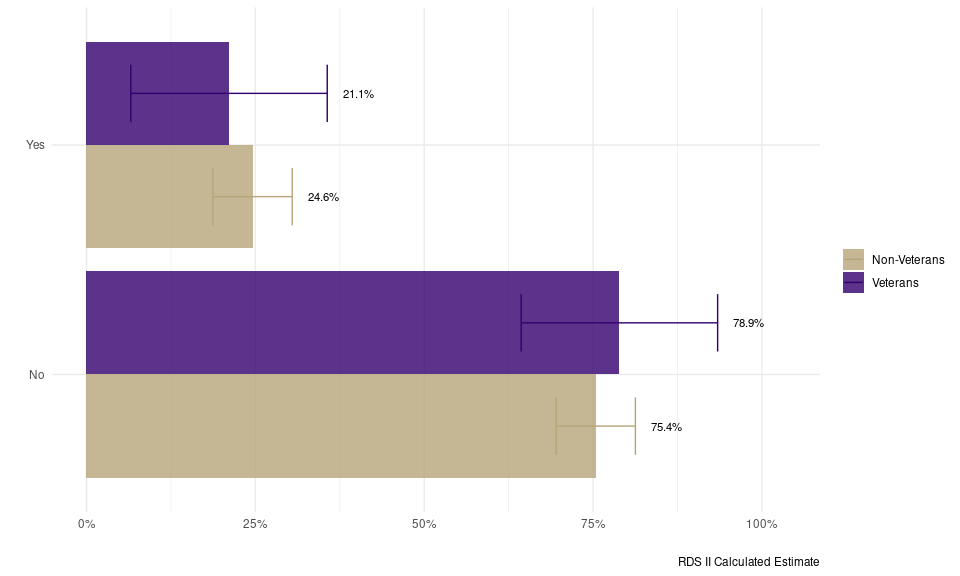
Ever Evicted
Imputed based on ‘15. Have you ever been evicted from a rental property?’ [UWRDS] and ‘Now think about the last place you lived, before you moved to your current residence. Were you forcibly evicted from that last place you lived?’ [UWRDS-PSD]
| Ever Evicted | Sample N | Sample Proportion | RDS II Estimate | RDS II 95% CI |
|---|---|---|---|---|
| No | 78 | 74.29% | 78.9% | [64.4%, 93.4%] |
| Yes | 27 | 25.71% | 21.1% | [6.6%, 35.6%] |
| Total | 105 | - | - | - |
| Ever Evicted | Sample N | Sample Proportion | RDS II Estimate | RDS II 95% CI |
|---|---|---|---|---|
| No | 610 | 74.75% | 75.4% | [69.5%, 81.3%] |
| Yes | 206 | 25.25% | 24.6% | [18.7%, 30.5%] |
| Total | 816 | - | - | - |
The difference between individual veterans and non-veterans is not significant, *χ2 = 0.65, (p = 0.622). These results were calculated based on the mean of 1000 bootstrapped tests. This value was calculated with replacement.*
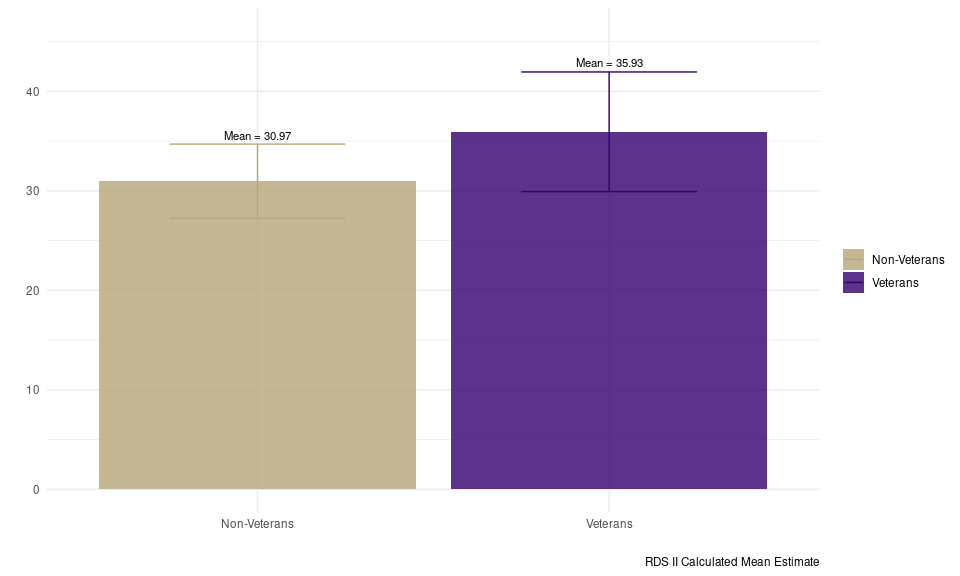
Age at Eviction
Imputed based on ‘15.1 How old were you? (please enter a number, for example: 30) [if yes to ’15. Have you ever been evicted from a rental property?’]’ This variable is not included for UWRDS-PSD survey observations.
| Veteran Status | Sample N | Sample Median | Sample Mean | Sample SE | RDS II Estimate | RDS II 95% CI |
|---|---|---|---|---|---|---|
| Non-Veterans | 183 | 28 | 30.02 | 0.88 | 30.97 | [27.24, 34.7] |
| Veterans | 23 | 38 | 39.74 | 3.22 | 35.93 | [29.92, 41.95] |
The difference between individual veterans and non-veterans is not significant, t(86.45) = 1.37, (p= 0.173).
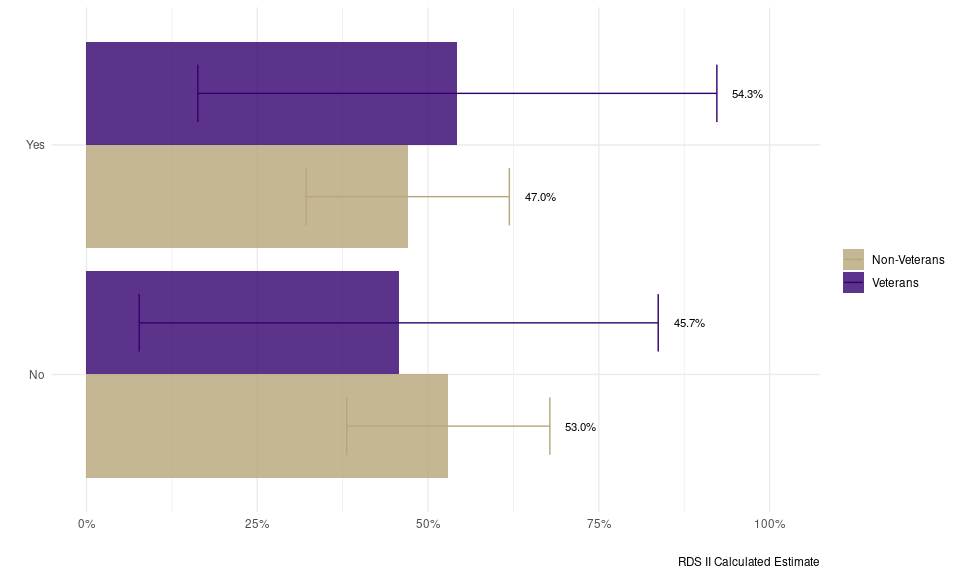
If Evicted, Ever Formally Evicted
‘15.2 Were you formally evicted by court order?’ This variable is not included for UWRDS-PSD survey observations.
| Ever Formally Evicted | Sample N | Sample Proportion | RDS II Estimate | RDS II 95% CI |
|---|---|---|---|---|
| No | 10 | 43.5% | 45.7% | [7.7%, 83.7%] |
| Yes | 13 | 56.5% | 54.3% | [16.3%, 92.3%] |
| Total | 23 | - | - | - |
| Ever Formally Evicted | Sample N | Sample Proportion | RDS II Estimate | RDS II 95% CI |
|---|---|---|---|---|
| No | 97 | 53.3% | 53.0% | [38.1%, 67.8%] |
| Yes | 85 | 46.7% | 47.0% | [32.2%, 61.9%] |
| Total | 182 | - | - | - |
The difference between individual veterans and non-veterans is not significant, *χ2 = 0.34, (p = 0.54). These results were calculated based on the mean of 1000 bootstrapped tests. This value was calculated with replacement.*
Sleep Status
Location Slept Previous Night
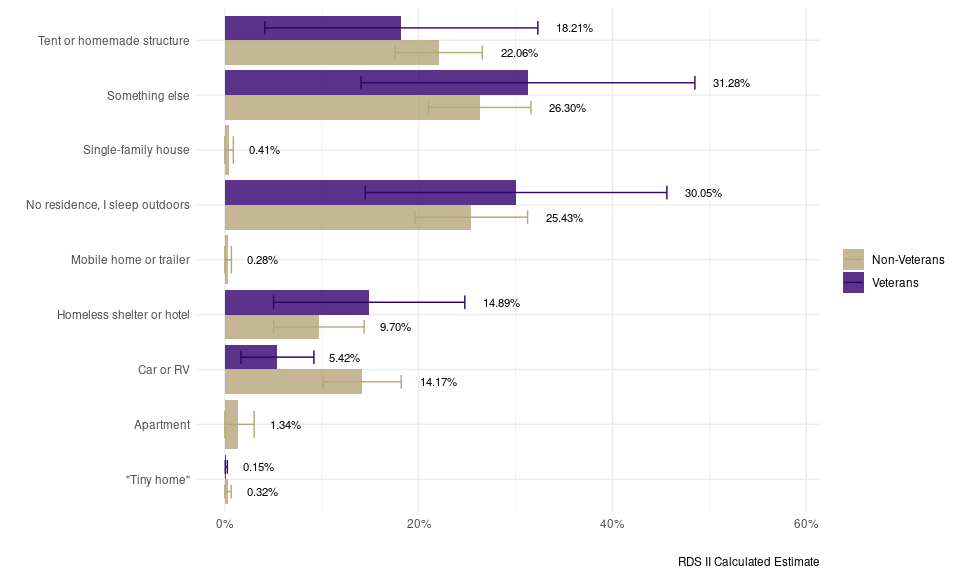
Where did you sleep last night?
Respondent’s sleep location based on ‘A. Regular residence’ in [UWRDS-PSD] and ‘7. Where did you sleep last night?’ [UWRDS]
| Sleep Location | Sample N | Sample Proportion | RDS II Estimate | RDS II 95% CI |
|---|---|---|---|---|
| “Tiny home” | 1 | 0.91% | 0.15% | [0.04%, 0.25%] |
| Apartment | 0 | NA | NA | NA |
| Car or RV | 10 | 9.09% | 5.42% | [1.66%, 9.19%] |
| Homeless shelter or hotel | 17 | 15.45% | 14.89% | [5.02%, 24.77%] |
| Mobile home or trailer | 0 | NA | NA | NA |
| No residence, I sleep outdoors | 29 | 26.36% | 30.05% | [14.48%, 45.62%] |
| Single-family house | 0 | NA | NA | NA |
| Something else | 34 | 30.91% | 31.28% | [14.05%, 48.51%] |
| Tent or homemade structure | 19 | 17.27% | 18.21% | [4.11%, 32.30%] |
| Total | 110 | - | - | - |
| Sleep Location | Sample N | Sample Proportion | RDS II Estimate | RDS II 95% CI |
|---|---|---|---|---|
| “Tiny home” | 3 | 0.31% | 0.32% | [-0.02%, 0.65%] |
| Apartment | 8 | 0.83% | 1.34% | [-0.35%, 3.02%] |
| Car or RV | 148 | 15.43% | 14.17% | [10.14%, 18.19%] |
| Homeless shelter or hotel | 82 | 8.55% | 9.70% | [5.02%, 14.37%] |
| Mobile home or trailer | 2 | 0.21% | 0.28% | [-0.12%, 0.68%] |
| No residence, I sleep outdoors | 219 | 22.84% | 25.43% | [19.61%, 31.24%] |
| Single-family house | 3 | 0.31% | 0.41% | [-0.04%, 0.87%] |
| Something else | 259 | 27.01% | 26.30% | [21.02%, 31.59%] |
| Tent or homemade structure | 235 | 24.50% | 22.06% | [17.57%, 26.56%] |
| Total | 959 | - | - | - |
The difference between individual veterans and non-veterans is not significant, *χ2 = 13.89, (p = 0.767). These results were calculated based on the mean of 1000 bootstrapped tests. *
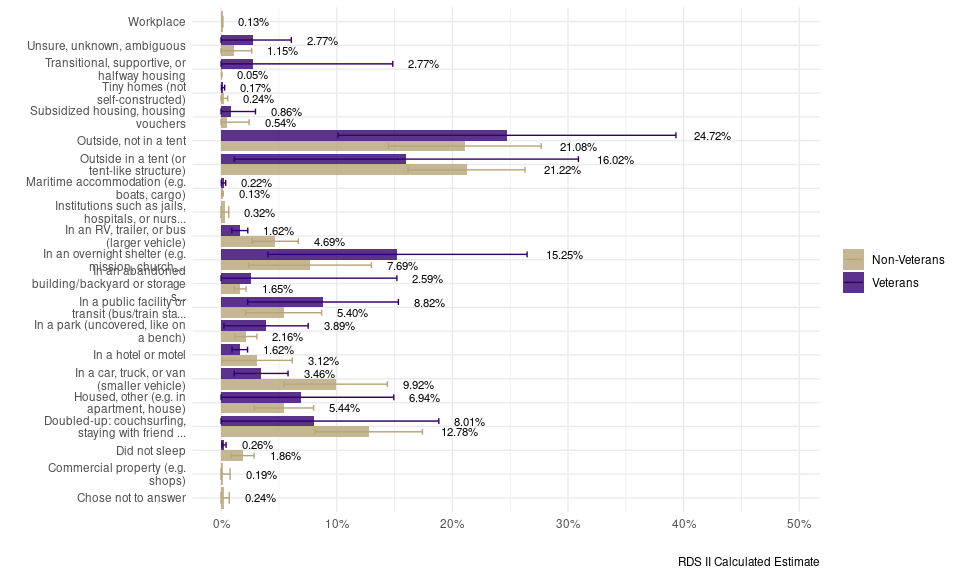
Re-coded: Where did you sleep last night?
7. Where did you sleep last night? - Imputed
| Sleep Location | Sample N | Sample Proportion | RDS II Estimate | RDS II 95% CI |
|---|---|---|---|---|
| Chose not to answer | 0 | NA | NA | NA |
| Commercial property (e.g. shops) | 0 | NA | NA | NA |
| Did not sleep | 1 | 1.06% | 0.26% | [0.09%, 0.43%] |
| Doubled-up: couchsurfing, staying with friend or family | 8 | 8.51% | 8.01% | [-2.80%, 18.83%] |
| Housed, other (e.g. in apartment, house) | 7 | 7.45% | 6.94% | [-1.05%, 14.93%] |
| In a car, truck, or van (smaller vehicle) | 7 | 7.45% | 3.46% | [1.14%, 5.79%] |
| In a hotel or motel | 2 | 2.13% | 1.62% | [0.95%, 2.29%] |
| In a park (uncovered, like on a bench) | 2 | 2.13% | 3.89% | [0.25%, 7.53%] |
| In a public facility or transit (bus/train station, transit center, hospital waiting room) | 6 | 6.38% | 8.82% | [2.30%, 15.33%] |
| In an RV, trailer, or bus (larger vehicle) | 2 | 2.13% | 1.62% | [0.93%, 2.31%] |
| In an abandoned building/backyard or storage structure | 1 | 1.06% | 2.59% | [-10.02%, 15.20%] |
| In an overnight shelter (e.g. mission, church, resource shelter, etc.) | 14 | 14.89% | 15.25% | [4.05%, 26.46%] |
| Institutions such as jails, hospitals, or nursing facilities | 0 | NA | NA | NA |
| Maritime accommodation (e.g. boats, cargo) | 1 | 1.06% | 0.22% | [0.03%, 0.40%] |
| Outside in a tent (or tent-like structure) | 14 | 14.89% | 16.02% | [1.14%, 30.90%] |
| Outside, not in a tent | 22 | 23.40% | 24.72% | [10.12%, 39.33%] |
| Subsidized housing, housing vouchers | 1 | 1.06% | 0.86% | [-1.25%, 2.98%] |
| Tiny homes (not self-constructed) | 1 | 1.06% | 0.17% | [0.03%, 0.31%] |
| Transitional, supportive, or halfway housing | 2 | 2.13% | 2.77% | [-9.32%, 14.85%] |
| Unsure, unknown, ambiguous | 3 | 3.19% | 2.77% | [-0.54%, 6.07%] |
| Workplace | 0 | NA | NA | NA |
| Total | 94 | - | - | - |
| Sleep Location | Sample N | Sample Proportion | RDS II Estimate | RDS II 95% CI |
|---|---|---|---|---|
| Chose not to answer | 2 | 0.27% | 0.24% | [-0.24%, 0.71%] |
| Commercial property (e.g. shops) | 1 | 0.13% | 0.19% | [-0.40%, 0.78%] |
| Did not sleep | 17 | 2.27% | 1.86% | [0.87%, 2.85%] |
| Doubled-up: couchsurfing, staying with friend or family | 103 | 13.73% | 12.78% | [8.15%, 17.41%] |
| Housed, other (e.g. in apartment, house) | 42 | 5.60% | 5.44% | [2.87%, 8.00%] |
| In a car, truck, or van (smaller vehicle) | 73 | 9.73% | 9.92% | [5.45%, 14.38%] |
| In a hotel or motel | 18 | 2.40% | 3.12% | [0.09%, 6.16%] |
| In a park (uncovered, like on a bench) | 17 | 2.27% | 2.16% | [1.22%, 3.10%] |
| In a public facility or transit (bus/train station, transit center, hospital waiting room) | 35 | 4.67% | 5.40% | [2.11%, 8.70%] |
| In an RV, trailer, or bus (larger vehicle) | 44 | 5.87% | 4.69% | [2.71%, 6.67%] |
| In an abandoned building/backyard or storage structure | 14 | 1.87% | 1.65% | [1.14%, 2.16%] |
| In an overnight shelter (e.g. mission, church, resource shelter, etc.) | 48 | 6.40% | 7.69% | [2.39%, 13.00%] |
| Institutions such as jails, hospitals, or nursing facilities | 2 | 0.27% | 0.32% | [-0.04%, 0.67%] |
| Maritime accommodation (e.g. boats, cargo) | 1 | 0.13% | 0.13% | [0.07%, 0.19%] |
| Outside in a tent (or tent-like structure) | 179 | 23.87% | 21.22% | [16.17%, 26.28%] |
| Outside, not in a tent | 140 | 18.67% | 21.08% | [14.47%, 27.68%] |
| Subsidized housing, housing vouchers | 3 | 0.40% | 0.54% | [-1.34%, 2.43%] |
| Tiny homes (not self-constructed) | 2 | 0.27% | 0.24% | [-0.09%, 0.57%] |
| Transitional, supportive, or halfway housing | 1 | 0.13% | 0.05% | [0.04%, 0.07%] |
| Unsure, unknown, ambiguous | 7 | 0.93% | 1.15% | [-0.35%, 2.65%] |
| Workplace | 1 | 0.13% | 0.13% | [0.10%, 0.16%] |
| Total | 750 | - | - | - |
The difference between individual veterans and non-veterans is not significant, *χ2 = 39.58, (p = 0.892). These results were calculated based on the mean of 1000 bootstrapped tests. *
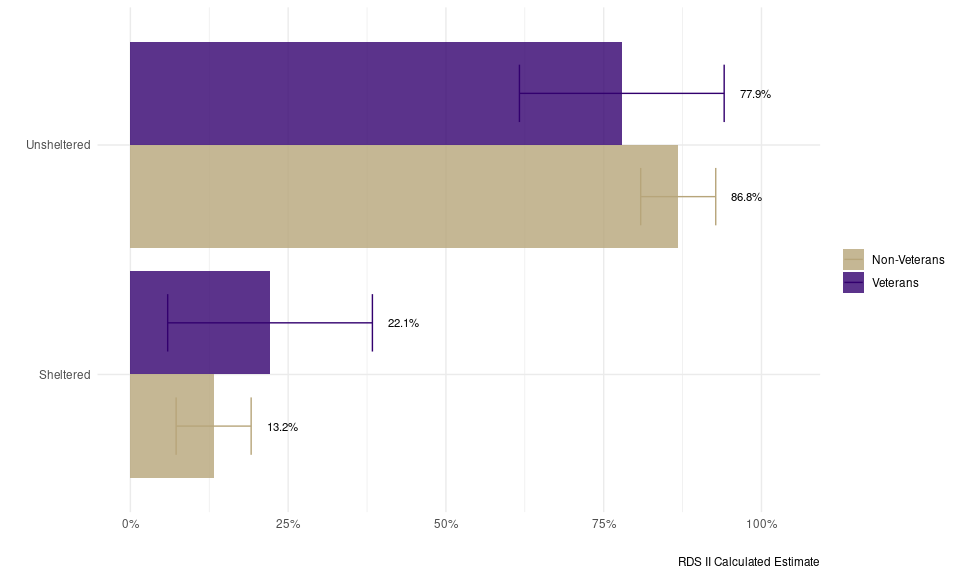
Sheltered vs. Unsheltered
Binary variable representing sheltered status based on previous sleep location for respondent
| Sheltered vs. Unsheltered | Sample N | Sample Proportion | RDS II Estimate | RDS II 95% CI |
|---|---|---|---|---|
| Sheltered | 21 | 24% | 22.1% | [5.9%, 38.4%] |
| Unsheltered | 67 | 76% | 77.9% | [61.6%, 94.1%] |
| Total | 88 | - | - | - |
| Sheltered vs. Unsheltered | Sample N | Sample Proportion | RDS II Estimate | RDS II 95% CI |
|---|---|---|---|---|
| Sheltered | 89 | 12% | 13.2% | [7.2%, 19.1%] |
| Unsheltered | 673 | 88% | 86.8% | [80.9%, 92.8%] |
| Total | 762 | - | - | - |
The difference between individual veterans and non-veterans is not significant, *χ2 = 5.61, (p = 0.321). These results were calculated based on the mean of 1000 bootstrapped tests. This value was calculated with replacement.*
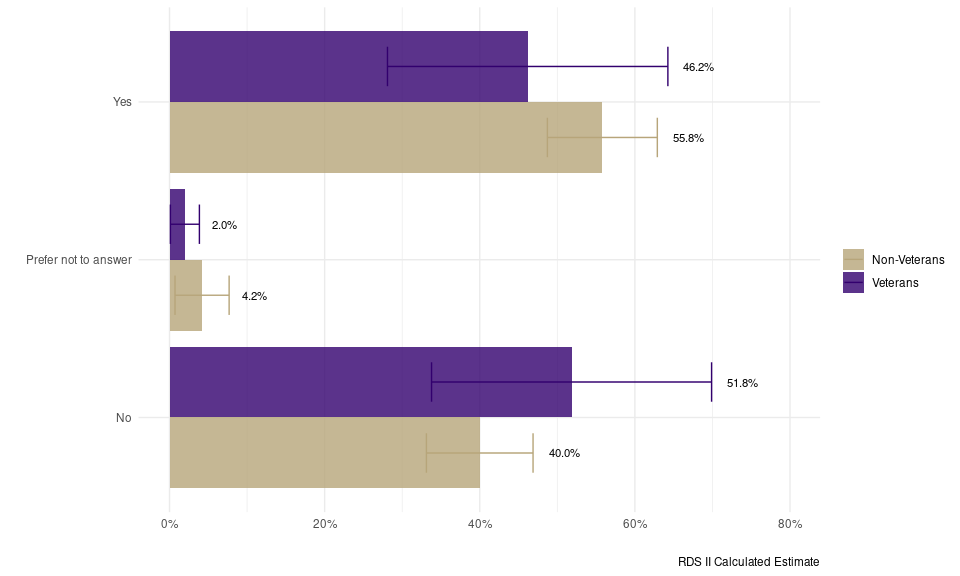
Would Accept Shelter
‘12. If you were offered a space in an emergency shelter this week, would you accept?’ This variable is not included for UWRDS-PSD survey observations.
| Would Accept Shelter | Sample N | Sample Proportion | RDS II Estimate | RDS II 95% CI |
|---|---|---|---|---|
| No | 49 | 51.58% | 51.8% | [33.78%, 69.9%] |
| Prefer not to answer | 3 | 3.16% | 2.0% | [0.12%, 3.8%] |
| Yes | 43 | 45.26% | 46.2% | [28.10%, 64.3%] |
| Total | 95 | - | - | - |
| Would Accept Shelter | Sample N | Sample Proportion | RDS II Estimate | RDS II 95% CI |
|---|---|---|---|---|
| No | 295 | 39.39% | 40.0% | [33.12%, 46.9%] |
| Prefer not to answer | 29 | 3.87% | 4.2% | [0.71%, 7.7%] |
| Yes | 425 | 56.74% | 55.8% | [48.72%, 62.9%] |
| Total | 749 | - | - | - |
The difference between individual veterans and non-veterans is not significant, *χ2 = 5.55, (p = 0.099). These results were calculated based on the mean of 1000 bootstrapped tests. This value was calculated with replacement.*
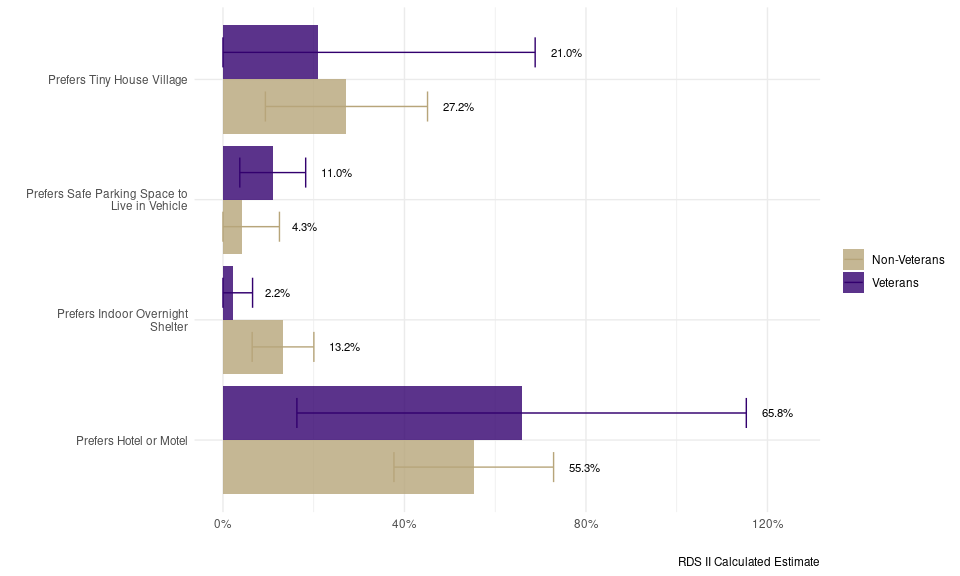
If Accepting, Shelter Preference
Variable based on Which of the following would you prefer for an emergency shelter? - Imputed. This variable is not included for UWRDS-PSD survey observations.
| Shelter Preference | Sample N | Sample Proportion | RDS II Estimate | RDS II 95% CI |
|---|---|---|---|---|
| Prefers Hotel or Motel | 5 | 50.0% | 65.8% | [16.3%, 115.3%] |
| Prefers Indoor Overnight Shelter | 1 | 10.0% | 2.2% | [-2.1%, 6.5%] |
| Prefers Safe Parking Space to Live in Vehicle | 1 | 10.0% | 11.0% | [3.7%, 18.2%] |
| Prefers Tiny House Village | 3 | 30.0% | 21.0% | [-26.8%, 68.8%] |
| Total | 10 | - | - | - |
| Shelter Preference | Sample N | Sample Proportion | RDS II Estimate | RDS II 95% CI |
|---|---|---|---|---|
| Prefers Hotel or Motel | 77 | 62.1% | 55.3% | [37.7%, 72.9%] |
| Prefers Indoor Overnight Shelter | 17 | 13.7% | 13.2% | [6.4%, 20.0%] |
| Prefers Safe Parking Space to Live in Vehicle | 4 | 3.2% | 4.3% | [-3.9%, 12.4%] |
| Prefers Tiny House Village | 26 | 21.0% | 27.2% | [9.4%, 45.1%] |
| Total | 124 | - | - | - |
The difference between individual veterans and non-veterans is not significant, *χ2 = 2.43, (p = 0.837). These results were calculated based on the mean of 1000 bootstrapped tests. This value was calculated with replacement.*
Experience of Homelessness
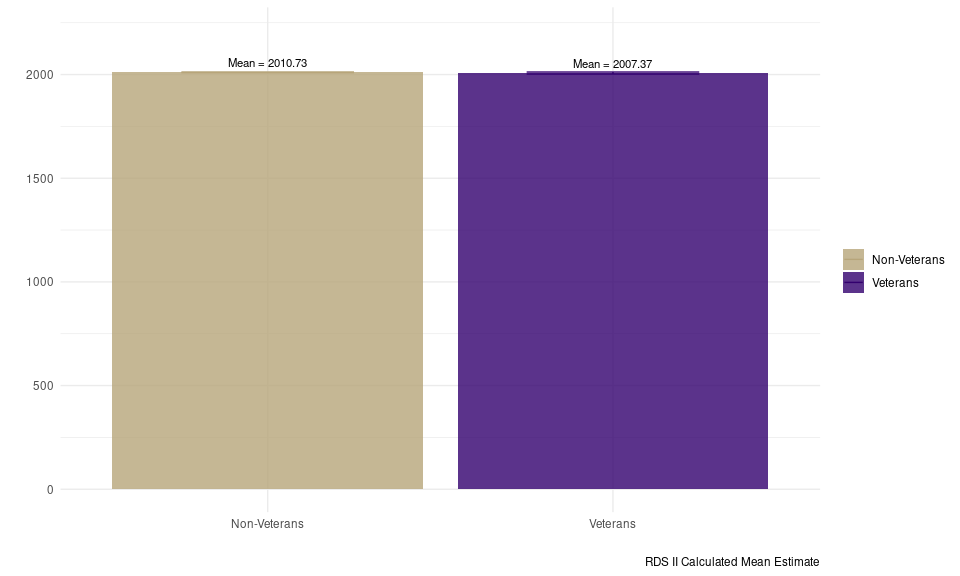
First Year Experiencing Homelessness
‘10. What year was your first experience of homelessness?’ This variable is not included for UWRDS-PSD survey observations.
| Veteran Status | Sample N | Sample Median | Sample Mean | Sample SE | RDS II Estimate | RDS II 95% CI |
|---|---|---|---|---|---|---|
| Non-Veterans | 744 | 2014 | 2010.40 | 0.42 | 2010.73 | [2009.02, 2012.44] |
| Veterans | 95 | 2012 | 2006.99 | 1.54 | 2007.37 | [2002.57, 2012.18] |
The difference between individual veterans and non-veterans is not significant, t(375.24) = -1.29, (p= 0.198).
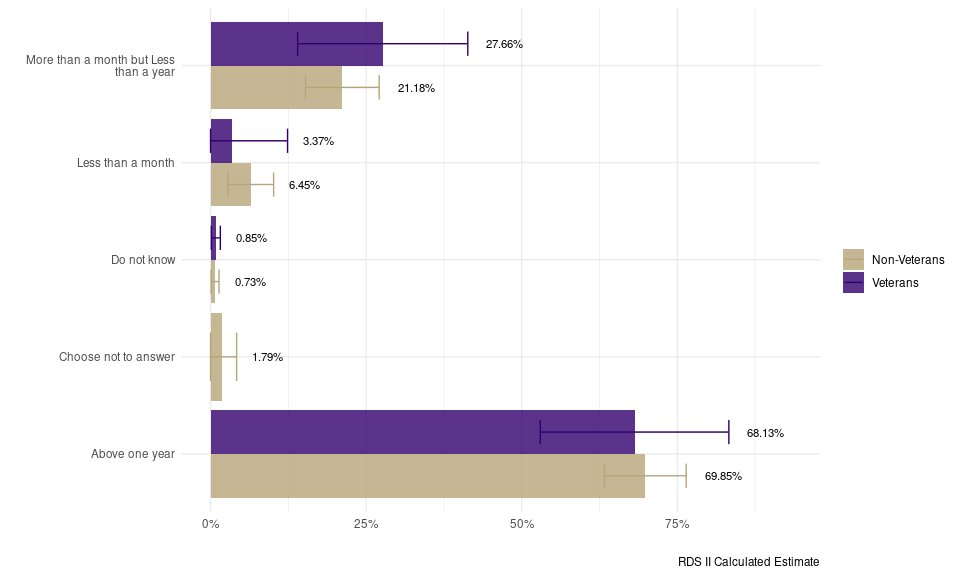
Time Experiencing Homelessness
Imputed based on ‘About how long have you been homeless’ [UWRDS-PSD] and ‘17. How long have you been homeless this time?’ [UWRDS-PSD]
| Duration Homeless | Sample N | Sample Proportion | RDS II Estimate | RDS II 95% CI |
|---|---|---|---|---|
| Above one year | 77 | 71.30% | 68.13% | [52.98%, 83.28%] |
| Choose not to answer | 0 | NA | NA | NA |
| Do not know | 3 | 2.78% | 0.85% | [0.13%, 1.57%] |
| Less than a month | 2 | 1.85% | 3.37% | [-5.64%, 12.37%] |
| More than a month but Less than a year | 26 | 24.07% | 27.66% | [13.99%, 41.33%] |
| Total | 108 | - | - | - |
| Duration Homeless | Sample N | Sample Proportion | RDS II Estimate | RDS II 95% CI |
|---|---|---|---|---|
| Above one year | 639 | 73.20% | 69.85% | [63.29%, 76.42%] |
| Choose not to answer | 13 | 1.49% | 1.79% | [-0.61%, 4.19%] |
| Do not know | 7 | 0.80% | 0.73% | [0.10%, 1.36%] |
| Less than a month | 46 | 5.27% | 6.45% | [2.76%, 10.13%] |
| More than a month but Less than a year | 168 | 19.24% | 21.18% | [15.26%, 27.09%] |
| Total | 873 | - | - | - |
The difference between individual veterans and non-veterans is not significant, *χ2 = 5.68, (p = 0.786). These results were calculated based on the mean of 1000 bootstrapped tests. This value was calculated with replacement.*
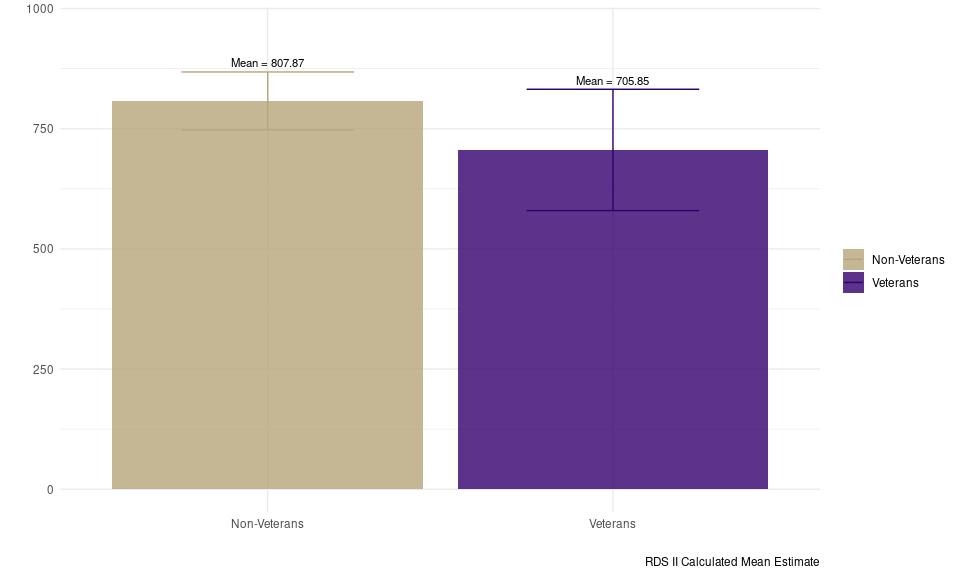
Days Homeless in Past Three Years
‘If you added up all the times you have been homeless in the last 3 years, about how long have you been homeless? - Imputed Total Days’ This variable is not included for UWRDS-PSD survey observations.
| Veteran Status | Sample N | Sample Median | Sample Mean | Sample SE | RDS II Estimate | RDS II 95% CI |
|---|---|---|---|---|---|---|
| Non-Veterans | 751 | 1095.00 | 816.88 | 13.77 | 807.87 | [747.71, 868.03] |
| Veterans | 95 | 913.14 | 734.24 | 41.38 | 705.85 | [579.64, 832.05] |
The difference between individual veterans and non-veterans is not significant, t(373.58) = -1.43, (p= 0.153).
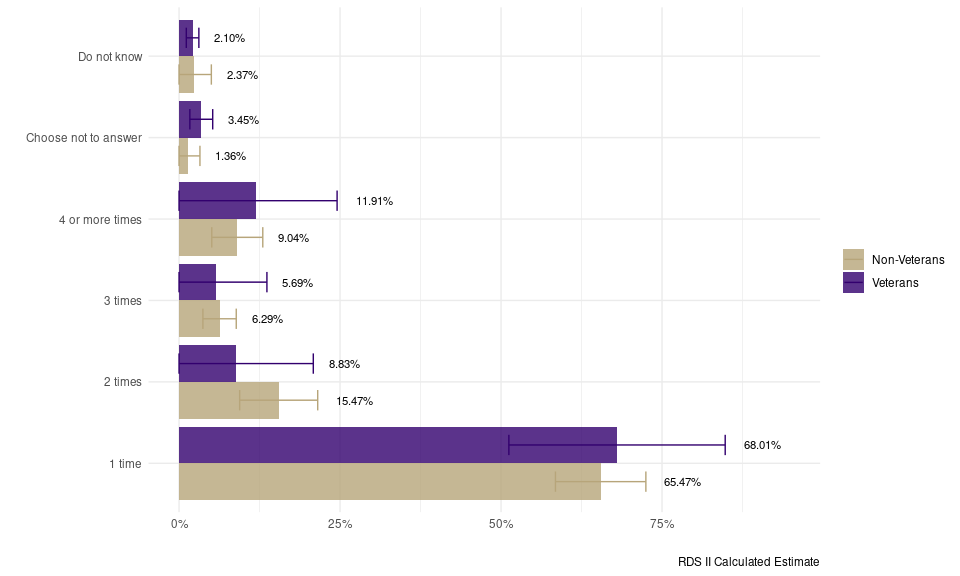
Number of Times Homeless in Past Three Years
‘18. Including this time, how many different times have you been homeless in the past 3 years, that is since April 2020?’ This variable is not included for UWRDS-PSD survey observations.
| Times Homeless | Sample N | Sample Proportion | RDS II Estimate | RDS II 95% CI |
|---|---|---|---|---|
| 1 time | 66 | 69.47% | 68.01% | [51.22%, 84.81%] |
| 2 times | 11 | 11.58% | 8.83% | [-3.18%, 20.85%] |
| 3 times | 3 | 3.16% | 5.69% | [-2.25%, 13.64%] |
| 4 or more times | 10 | 10.53% | 11.91% | [-0.73%, 24.54%] |
| Choose not to answer | 2 | 2.11% | 3.45% | [1.68%, 5.22%] |
| Do not know | 3 | 3.16% | 2.10% | [1.12%, 3.08%] |
| Total | 95 | - | - | - |
| Times Homeless | Sample N | Sample Proportion | RDS II Estimate | RDS II 95% CI |
|---|---|---|---|---|
| 1 time | 497 | 66.27% | 65.47% | [58.45%, 72.49%] |
| 2 times | 103 | 13.73% | 15.47% | [9.41%, 21.53%] |
| 3 times | 46 | 6.13% | 6.29% | [3.70%, 8.88%] |
| 4 or more times | 78 | 10.40% | 9.04% | [5.08%, 13.00%] |
| Choose not to answer | 11 | 1.47% | 1.36% | [-0.53%, 3.24%] |
| Do not know | 15 | 2.00% | 2.37% | [-0.27%, 5.01%] |
| Total | 750 | - | - | - |
The difference between individual veterans and non-veterans is not significant, *χ2 = 5.94, (p = 0.824). These results were calculated based on the mean of 1000 bootstrapped tests. This value was calculated with replacement.*
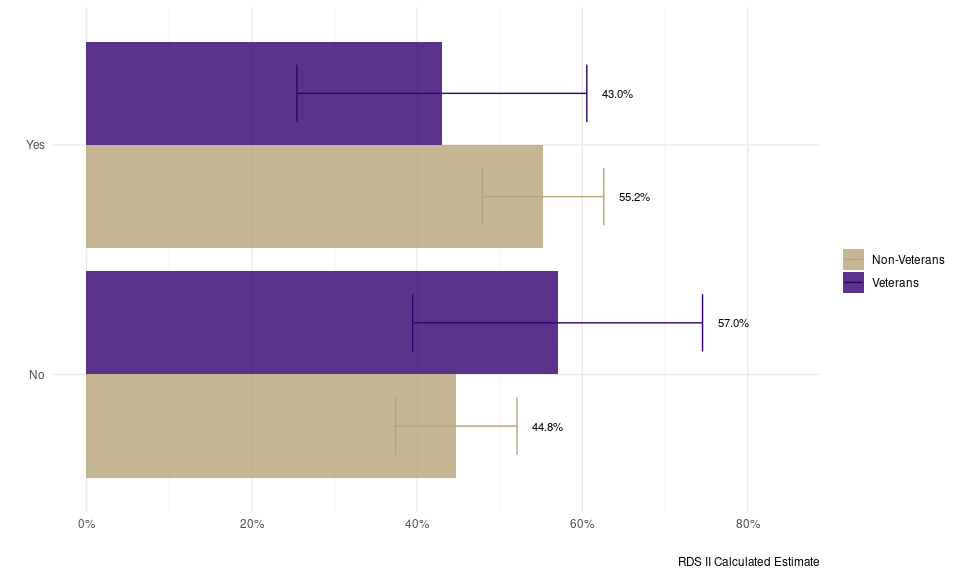
Experiencing Chronic Homelessness
Binary imputed variable for HUD’s chronic homelessness designation
| Experiencing Chronic Homelessness | Sample N | Sample Proportion | RDS II Estimate | RDS II 95% CI |
|---|---|---|---|---|
| No | 49 | 51.6% | 57.0% | [39.5%, 74.5%] |
| Yes | 46 | 48.4% | 43.0% | [25.5%, 60.5%] |
| Total | 95 | - | - | - |
| Experiencing Chronic Homelessness | Sample N | Sample Proportion | RDS II Estimate | RDS II 95% CI |
|---|---|---|---|---|
| No | 296 | 39.4% | 44.8% | [37.4%, 52.1%] |
| Yes | 455 | 60.6% | 55.2% | [47.9%, 62.6%] |
| Total | 751 | - | - | - |
The difference between individual veterans and non-veterans is not significant, *χ2 = 5.3, (p = 0.173). These results were calculated based on the mean of 1000 bootstrapped tests. This value was calculated with replacement.*
Connections
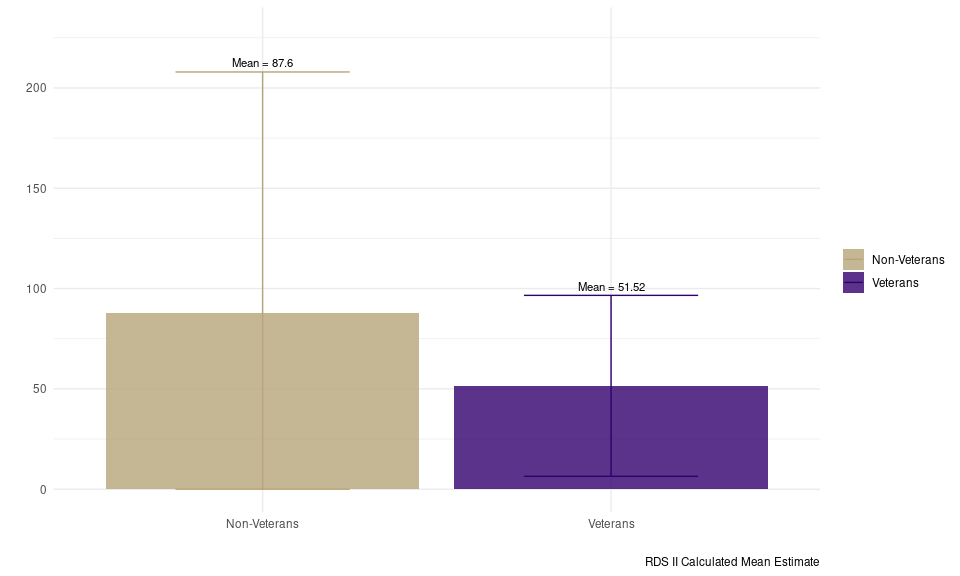
Number of Estimated Homeless People Known
Outside of your family living with you, how many people do you personally know who are unhoused or experiencing homelessness? - Imputed
| Veteran Status | Sample N | Sample Median | Sample Mean | Sample SE | RDS II Estimate | RDS II 95% CI |
|---|---|---|---|---|---|---|
| Non-Veterans | 924 | 12 | 78.93 | 25.04 | 87.60 | [-32.77, 207.97] |
| Veterans | 108 | 10 | 69.99 | 23.21 | 51.52 | [6.44, 96.61] |
The difference between individual veterans and non-veterans is not significant, t(62.13) = -0.55, (p= 0.584).
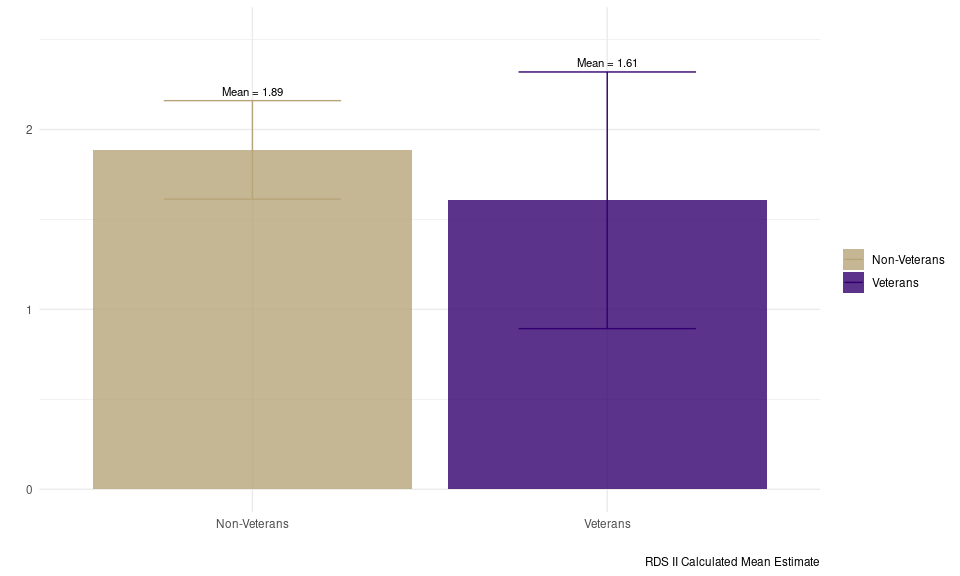
Number of Named Homeless People Known
Number of named non-household contacts
| Veteran Status | Sample N | Sample Median | Sample Mean | Sample SE | RDS II Estimate | RDS II 95% CI |
|---|---|---|---|---|---|---|
| Non-Veterans | 960 | 3 | 4.10 | 0.14 | 1.89 | [1.61, 2.16] |
| Veterans | 111 | 3 | 4.23 | 0.46 | 1.61 | [0.89, 2.32] |
The difference between individual veterans and non-veterans is not significant, t(438.91) = -0.55, (p= 0.583).
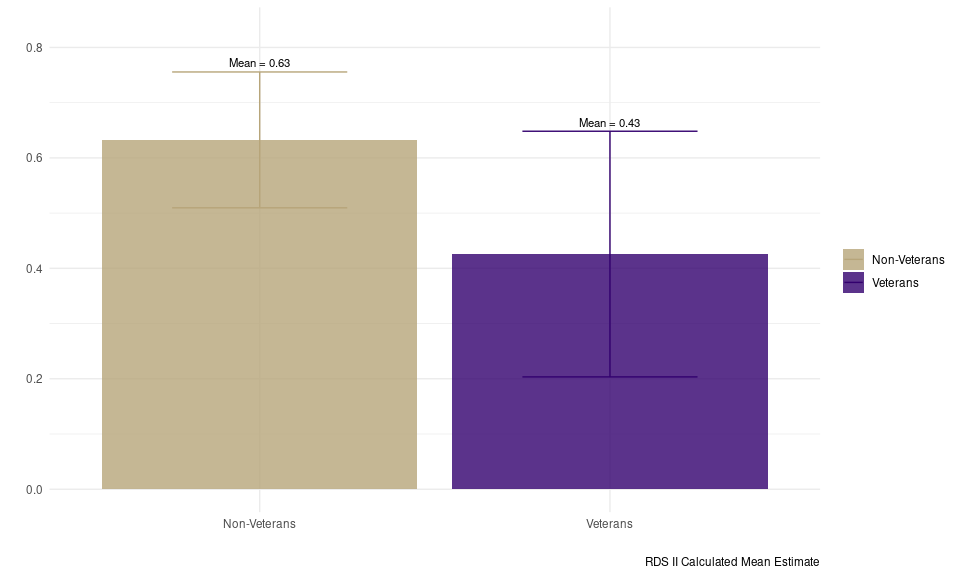
Number of Household Members
Imputed count of household members based on ‘27. Please list the initials of all the people in your household.’
| Veteran Status | Sample N | Sample Median | Sample Mean | Sample SE | RDS II Estimate | RDS II 95% CI |
|---|---|---|---|---|---|---|
| Non-Veterans | 764 | 0 | 0.69 | 0.05 | 0.63 | [0.51, 0.76] |
| Veterans | 95 | 0 | 0.53 | 0.14 | 0.43 | [0.2, 0.65] |
The difference between individual veterans and non-veterans is not significant, t(371.72) = -1.59, (p= 0.112).
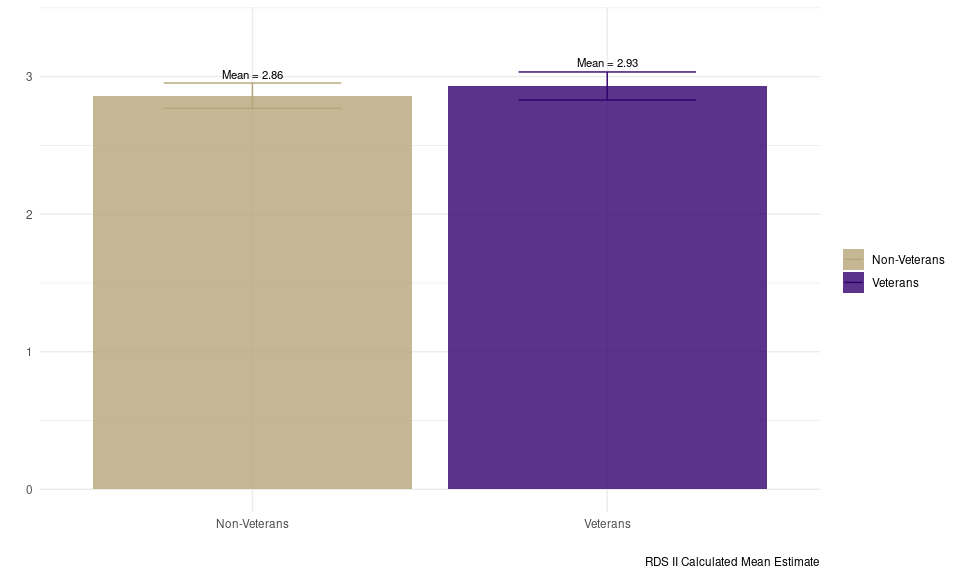
Number of Coupons Distributed
Total number of individuals the respondent referred who took the survey
| Veteran Status | Sample N | Sample Median | Sample Mean | Sample SE | RDS II Estimate | RDS II 95% CI |
|---|---|---|---|---|---|---|
| Non-Veterans | 971 | 3 | 2.88 | 0.02 | 2.86 | [2.77, 2.95] |
| Veterans | 111 | 3 | 2.93 | 0.04 | 2.93 | [2.83, 3.03] |
The difference between individual veterans and non-veterans is not significant, t(409.1) = 1.01, (p= 0.315).
Benefits
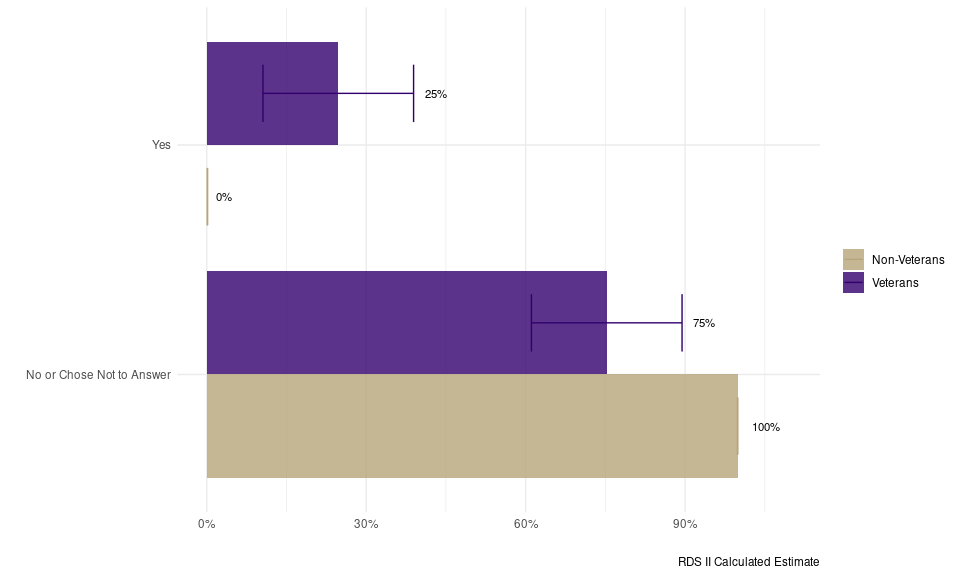
Veteran Affairs Benefits
‘13. Are you receiving any of the following benefits? (Select all that apply) - Selected Choice Veteran’s Administration (VA)’ This variable is not included for UWRDS-PSD survey observations.
| Receiving VA Benefits | Sample N | Sample Proportion | RDS II Estimate | RDS II 95% CI |
|---|---|---|---|---|
| No or Chose Not to Answer | 68 | 72% | 75% | [61%, 89%] |
| Yes | 27 | 28% | 25% | [11%, 39%] |
| Total | 95 | - | - | - |
| Receiving VA Benefits | Sample N | Sample Proportion | RDS II Estimate | RDS II 95% CI |
|---|---|---|---|---|
| No or Chose Not to Answer | 749 | 100% | 100% | [100%, 100%] |
| Yes | 2 | 0% | 0% | [0%, 0%] |
| Total | 751 | - | - | - |
The difference between individual veterans and non-veterans is significant at the .05 level, *χ2 = 168.07, (p = 0). These results were calculated based on the mean of 1000 bootstrapped tests. This value was calculated with replacement.*
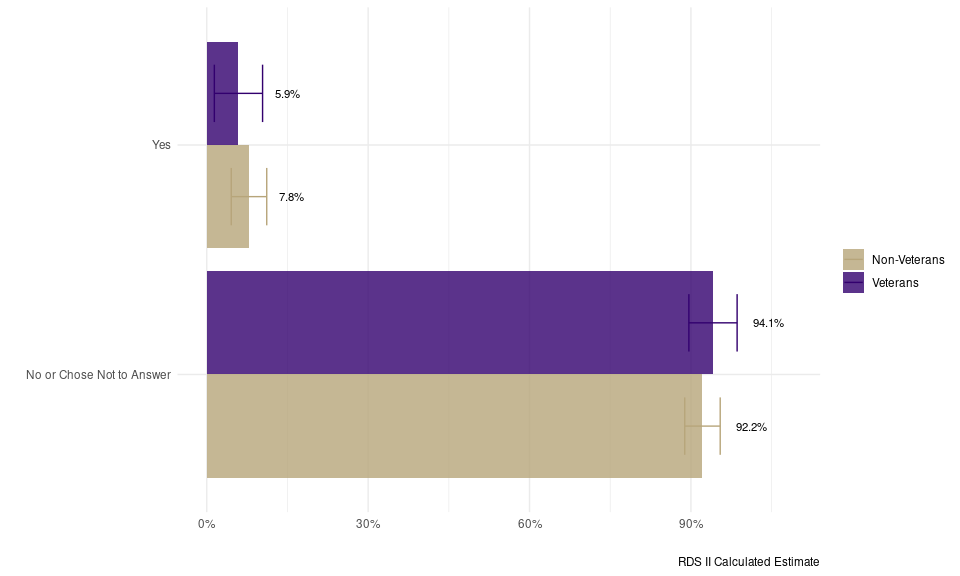
Disability Benefits
‘13. Are you receiving any of the following benefits? (Select all that apply) - Selected Choice WA Aged, Blind, or Disabled cash assistance’ This variable is not included for UWRDS-PSD survey observations.
| Receiving Disability Benefits | Sample N | Sample Proportion | RDS II Estimate | RDS II 95% CI |
|---|---|---|---|---|
| No or Chose Not to Answer | 90 | 94.7% | 94.1% | [89.62%, 98.59%] |
| Yes | 5 | 5.3% | 5.9% | [1.41%, 10.38%] |
| Total | 95 | - | - | - |
| Receiving Disability Benefits | Sample N | Sample Proportion | RDS II Estimate | RDS II 95% CI |
|---|---|---|---|---|
| No or Chose Not to Answer | 683 | 91.0% | 92.2% | [88.85%, 95.44%] |
| Yes | 68 | 9.0% | 7.8% | [4.56%, 11.15%] |
| Total | 751 | - | - | - |
The difference between individual veterans and non-veterans is not significant, *χ2 = 0.48, (p = 0.533). These results were calculated based on the mean of 1000 bootstrapped tests. This value was calculated with replacement.*
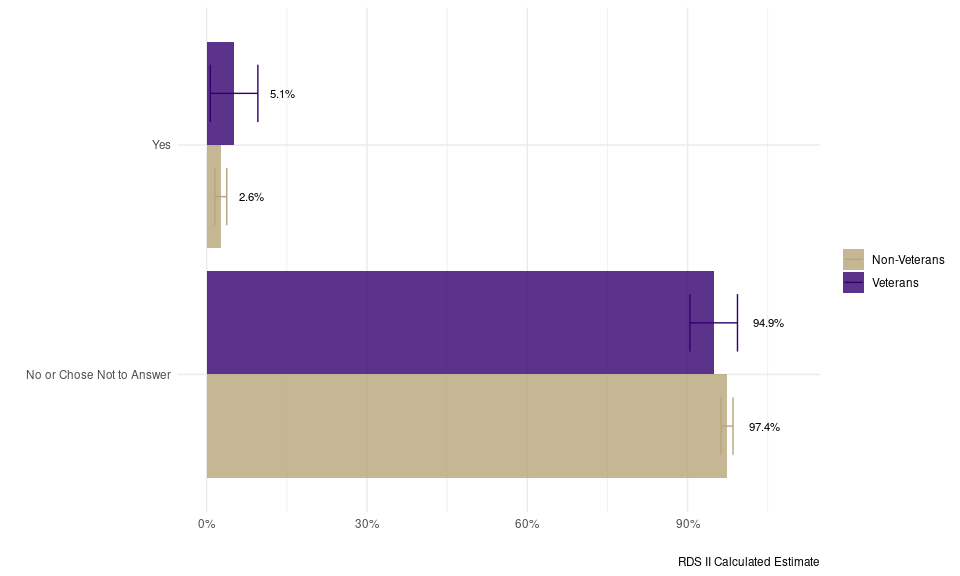
Housing Benefits
‘13. Are you receiving any of the following benefits? (Select all that apply) - Selected Choice: ’WA Housing and Essential Needs program’ - Imputed with text response.’ This variable is not included for UWRDS-PSD survey observations.
| Receiving Housing Benefits | Sample N | Sample Proportion | RDS II Estimate | RDS II 95% CI |
|---|---|---|---|---|
| No or Chose Not to Answer | 87 | 91.6% | 94.9% | [90.43%, 99.33%] |
| Yes | 8 | 8.4% | 5.1% | [0.67%, 9.57%] |
| Total | 95 | - | - | - |
| Receiving Housing Benefits | Sample N | Sample Proportion | RDS II Estimate | RDS II 95% CI |
|---|---|---|---|---|
| No or Chose Not to Answer | 722 | 96.1% | 97.4% | [96.26%, 98.49%] |
| Yes | 29 | 3.9% | 2.6% | [1.51%, 3.74%] |
| Total | 751 | - | - | - |
The difference between individual veterans and non-veterans is not significant, *χ2 = 1.91, (p = 0.27). These results were calculated based on the mean of 1000 bootstrapped tests. This value was calculated with replacement.*
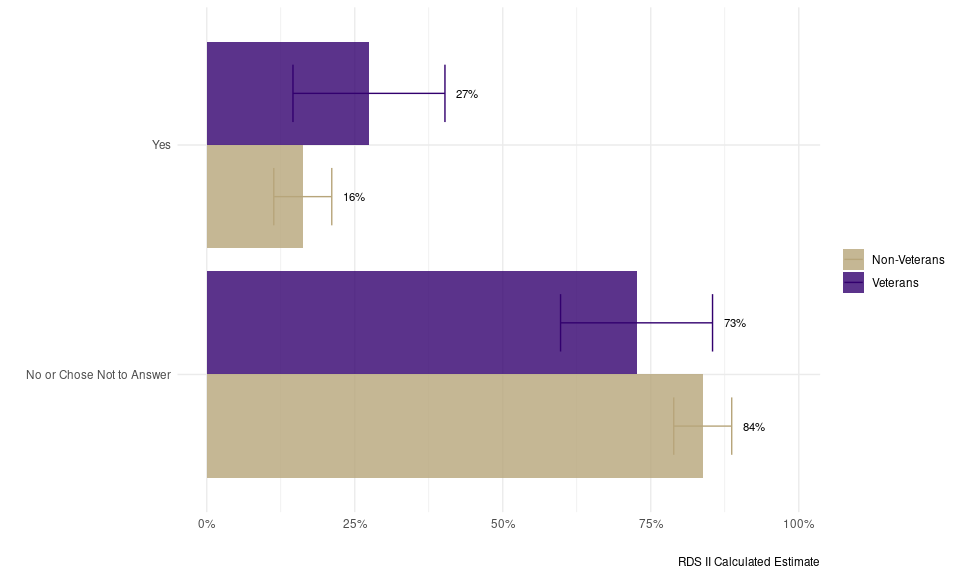
SSI Benefits
‘13. Are you receiving any of the following benefits? (Select all that apply) - Selected Choice: ’Federal Supplemental Security Income (SSI), Social Security Disability Insurance (SSDI), or other social security benefit’ - Imputed with text response.’ This variable is not included for UWRDS-PSD survey observations.
| Receiving SSI Benefits | Sample N | Sample Proportion | RDS II Estimate | RDS II 95% CI |
|---|---|---|---|---|
| No or Chose Not to Answer | 69 | 73% | 73% | [59.8%, 85.4%] |
| Yes | 26 | 27% | 27% | [14.6%, 40.2%] |
| Total | 95 | - | - | - |
| Receiving SSI Benefits | Sample N | Sample Proportion | RDS II Estimate | RDS II 95% CI |
|---|---|---|---|---|
| No or Chose Not to Answer | 627 | 83% | 84% | [78.9%, 88.7%] |
| Yes | 124 | 17% | 16% | [11.3%, 21.1%] |
| Total | 751 | - | - | - |
The difference between individual veterans and non-veterans is not significant, *χ2 = 7.54, (p = 0.649). These results were calculated based on the mean of 1000 bootstrapped tests. This value was calculated with replacement.*
Medicaid Benefits
‘13. Are you receiving any of the following benefits? (Select all that apply) - Selected Choice: ’Medicaid (in Washington state, this is Apple Health)’ - Imputed with text response.’ This variable is not included for UWRDS-PSD survey observations.
| Receiving Medicaid Benefits | Sample N | Sample Proportion | RDS II Estimate | RDS II 95% CI |
|---|---|---|---|---|
| No or Chose Not to Answer | 53 | 55.79% | 63.7% | [47.0%, 80.3%] |
| Yes | 42 | 44.21% | 36.3% | [19.7%, 53.0%] |
| Total | 95 | - | - | - |
| Receiving Medicaid Benefits | Sample N | Sample Proportion | RDS II Estimate | RDS II 95% CI |
|---|---|---|---|---|
| No or Chose Not to Answer | 339 | 45.14% | 48.7% | [41.5%, 55.9%] |
| Yes | 412 | 54.86% | 51.3% | [44.1%, 58.5%] |
| Total | 751 | - | - | - |
The difference between individual veterans and non-veterans is not significant, *χ2 = 7.85, (p = 0.209). These results were calculated based on the mean of 1000 bootstrapped tests. This value was calculated with replacement.*

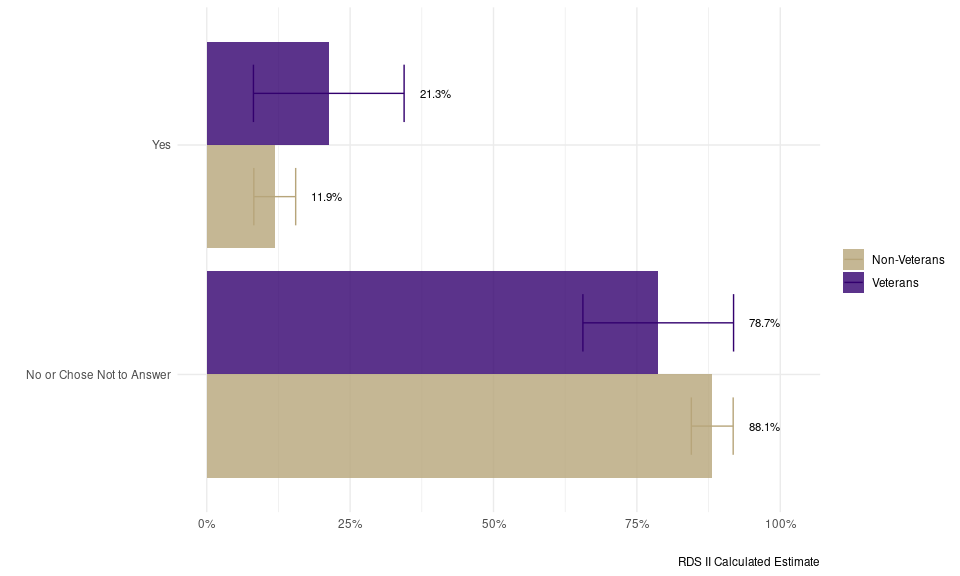
Medicare Benefits
‘13. Are you receiving any of the following benefits? (Select all that apply) - Selected Choice Medicare’ This variable is not included for UWRDS-PSD survey observations.
| Receiving Medicare Benefits | Sample N | Sample Proportion | RDS II Estimate | RDS II 95% CI |
|---|---|---|---|---|
| No or Chose Not to Answer | 71 | 75% | 78.7% | [65.59%, 91.86%] |
| Yes | 24 | 25% | 21.3% | [8.14%, 34.41%] |
| Total | 95 | - | - | - |
| Receiving Medicare Benefits | Sample N | Sample Proportion | RDS II Estimate | RDS II 95% CI |
|---|---|---|---|---|
| No or Chose Not to Answer | 667 | 89% | 88.1% | [84.49%, 91.79%] |
| Yes | 84 | 11% | 11.9% | [8.21%, 15.51%] |
| Total | 751 | - | - | - |
The difference between individual veterans and non-veterans is significant at the .05 level, *χ2 = 6.86, (p = 0.016). These results were calculated based on the mean of 1000 bootstrapped tests. This value was calculated with replacement.*
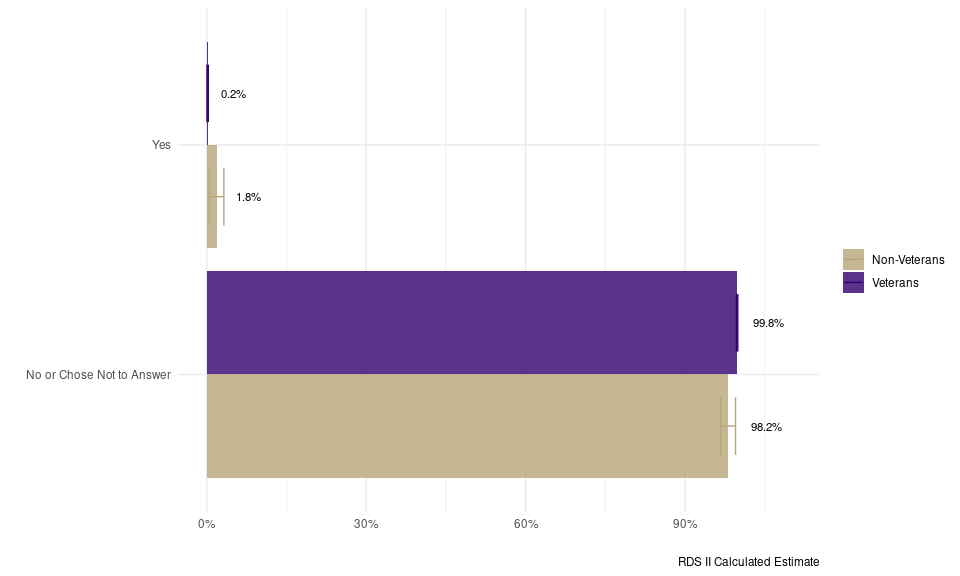
Indian Health Service Benefits
‘13. Are you receiving any of the following benefits? (Select all that apply) - Selected Choice: ’Indian Health Services’ - Imputed with text response.’ This variable is not included for UWRDS-PSD survey observations.
| Receiving IHS Benefits | Sample N | Sample Proportion | RDS II Estimate | RDS II 95% CI |
|---|---|---|---|---|
| No or Chose Not to Answer | 94 | 99.0% | 99.8% | [99.70%, 99.95%] |
| Yes | 1 | 1.0% | 0.2% | [0.05%, 0.30%] |
| Total | 95 | - | - | - |
| Receiving IHS Benefits | Sample N | Sample Proportion | RDS II Estimate | RDS II 95% CI |
|---|---|---|---|---|
| No or Chose Not to Answer | 733 | 97.6% | 98.2% | [96.78%, 99.53%] |
| Yes | 18 | 2.4% | 1.8% | [0.47%, 3.22%] |
| Total | 751 | - | - | - |
The difference between individual veterans and non-veterans is not significant, *χ2 = 1.53, (p = 0.247). These results were calculated based on the mean of 1000 bootstrapped tests. This value was calculated with replacement.*
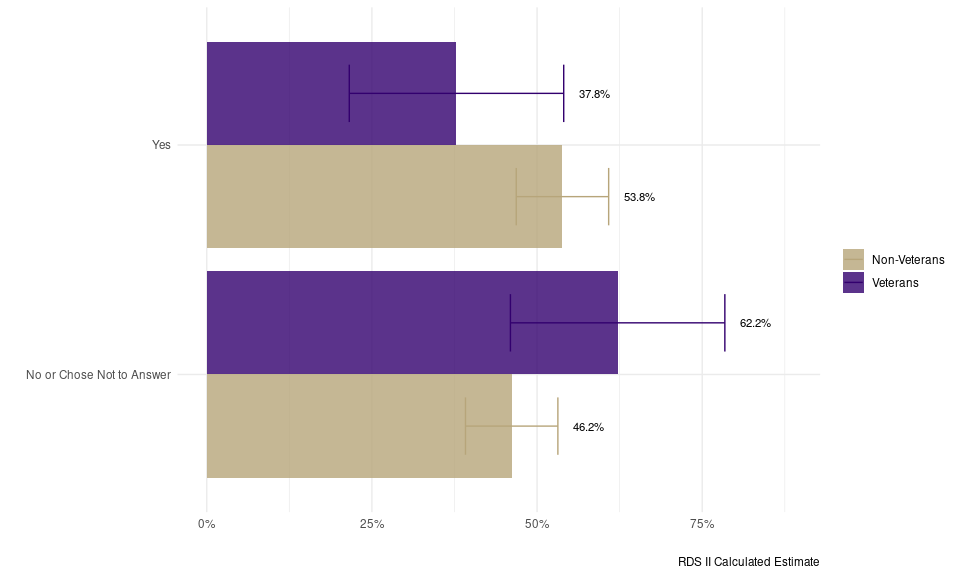
Other Benefits
‘13. Are you receiving any of the following benefits? - Other - Imputed’ This variable is not included for UWRDS-PSD survey observations.
| Receiving Other Benefits | Sample N | Sample Proportion | RDS II Estimate | RDS II 95% CI |
|---|---|---|---|---|
| No or Chose Not to Answer | 56 | 59.0% | 62.2% | [45.97%, 78.42%] |
| Yes | 39 | 41.0% | 37.8% | [21.58%, 54.03%] |
| Total | 95 | - | - | - |
| Receiving Other Benefits | Sample N | Sample Proportion | RDS II Estimate | RDS II 95% CI |
|---|---|---|---|---|
| No or Chose Not to Answer | 344 | 45.8% | 46.2% | [39.16%, 53.15%] |
| Yes | 407 | 54.2% | 53.8% | [46.85%, 60.84%] |
| Total | 751 | - | - | - |
The difference between individual veterans and non-veterans is not significant, *χ2 = 9.04, (p = 0.109). These results were calculated based on the mean of 1000 bootstrapped tests. This value was calculated with replacement.*